This section includes three important logging methods for obtaining the physical properties of rocks. These are a typical suspension logging method, an integrated logging system and Crosshole shear logging.
Borehole engineering logging surveys are performed to accurately acquire rock properties, structural stress-strain relationships, fracture statistics, and other in-situ properties for major tunneling and engineering projects. Wireline logging methods have been shown to dramatically reduce costs of rock quality analysis by reducing the number of core samples required for laboratory analysis.
Suspension logging
Basic Concept: Suspension P-S velocity logging, or suspension logging for short, is a method for determining shear (VS) compressional (VP) wave velocity profiles. Measurements are made in a single, uncased, fluid-filled borehole. It is similar to full-waveform sonic logging, but is optimized for low frequency measurements in soil.
A diagram of the suspension logging setup is shown in figure 173, showing the OYO PS 170 system. A solenoid source generates an acoustic wave in the borehole fluid, which impacts the borehole wall. Both P- and SV-waves are generated, which travel radially away from the borehole wall. A portion of the energy travels along the formation as a head wave and radiates energy back into the fluid. These waves are sensed by two geophones on the probe. The geophone separation (distance) divided by the difference in travel time is equal to the average velocity of the formation over that interval.
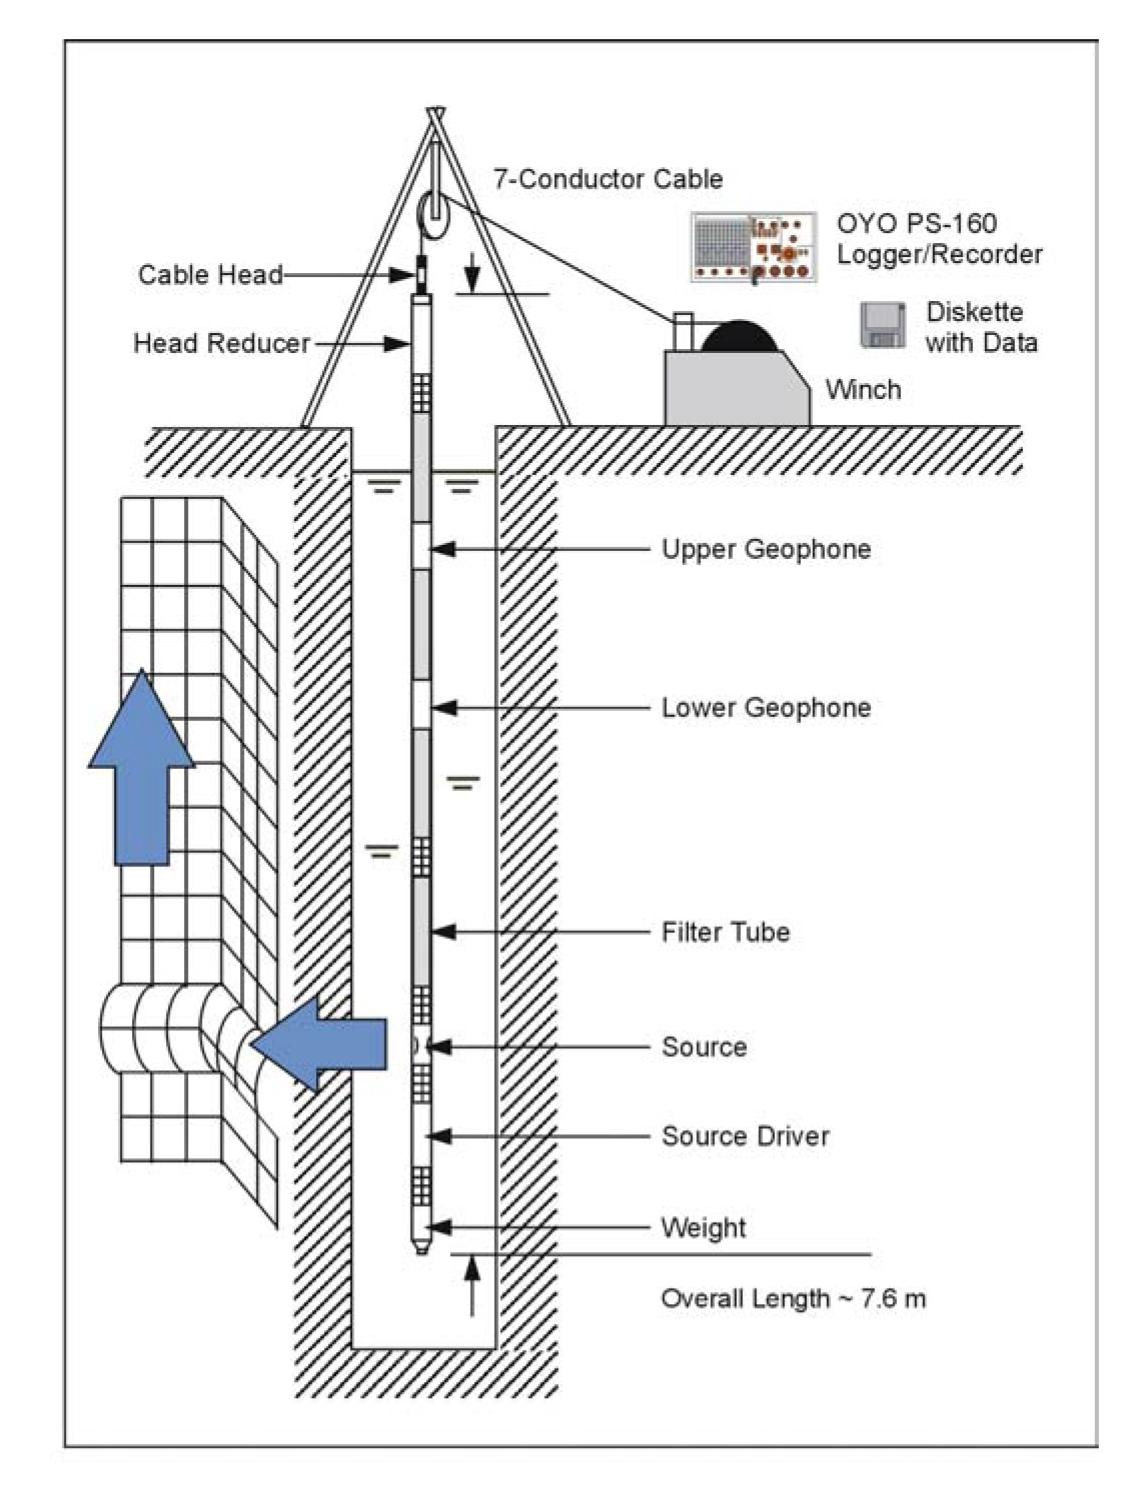
Figure 173. Schematic showing suspension logging system. (GEOVision Geophysical Services)
Commonly, measurements are made at 0.5 to 1-m intervals, although the data can be processed for higher resolution. The method has been proven at depths up to 2 km.
Data Acquisition: A typical suspension P-S Logging system, one of which is manufactured by OYO Corporation, consists of a borehole probe, cable, winch, and control/recording instrument. The probe length is approximately 7 meters.
The probe consists of a source and two biaxial geophones, separated by flexible isolation sections. It is centered in the borehole via the attached nylon whiskers. The solenoid source is reversible and produces energy between 500 and 5000 Hz. In practice, the maximum spectral amplitudes is stiff soil or soft rock are around 1000 Hz for shear waves and 3000 Hz for compressional waves. The corresponding wavelengths are tens of centimeters.
The separation between geophones is one meter. The vertical axis of the geophone corresponds to P-wave energy and the horizontal to S-wave energy. The probe is connected to the recorder on the surface by an armored 7-conducter cable. The cable serves both to support the probe, to transmit activation signals to the source, and to transmit the geophone signals back to the recorder. The depth is measured by the rotary encoder on the winch.
The electronics system activates the source, and records the geophone signals on different channels. Modern loggers have up to 8 channels. Filters may be used in acquisition, but data are usually recorded unfiltered and digitally filtered later during processing.
The measurement procedure is as follows. The probe is lowered to the bottom of the borehole to verify total depth and then raised slightly to the first measurement point. The source is activated in one direction and the output from the two horizontal geophones (SH-wave) is recorded. The source is then activated in the reverse direction, producing a reverse polarity SH-wave. Finally, the source is activated in the first direction again and the vertical geophone signal recorded, which represents the P-wave.
After the data is stored, the probe is raised to the next level and the measurement sequence repeated. Gains, record length, filters, and stacking can be adjusted during acquisition.
Data Processing: The stored data are transferred from floppy disk to a personal computer for processing. PS Log, Dos-based software provided with the suspension logging system, is used to pick the wave arrivals and compute the velocities. A complete record for one depth is shown in figure 174.
Commonly, the first break or first peak is picked on each waveform. If the data are noisy, they can be filtered digitally first. The time differences between horizontal and vertical receivers (R1-R2) are used to calculate the interval S- and P-wave velocities, respectively, over the 1-m interval. These values are compared with source to receiver (S-R1) travel times and velocities.
Ideally, the shear wave signal on the horizontal geophones should be a mirror image for normal and reverse source activation. This aids in identifying the first arrival of the shear wave. The velocities calculated from normal and reverse polarity are averaged.
Data Interpretation: The processed suspension logging results consist of the VS and VP profile, sampled at the measurement interval. Commonly no further interpretation is done. If desired, constant velocity layers can be fit to the discrete velocity points, by averaging travel time (or 1/V) over the layer depths. Interfaces, such as the depth to water table in sediments, and the soil/rock transition, can usually be identified.
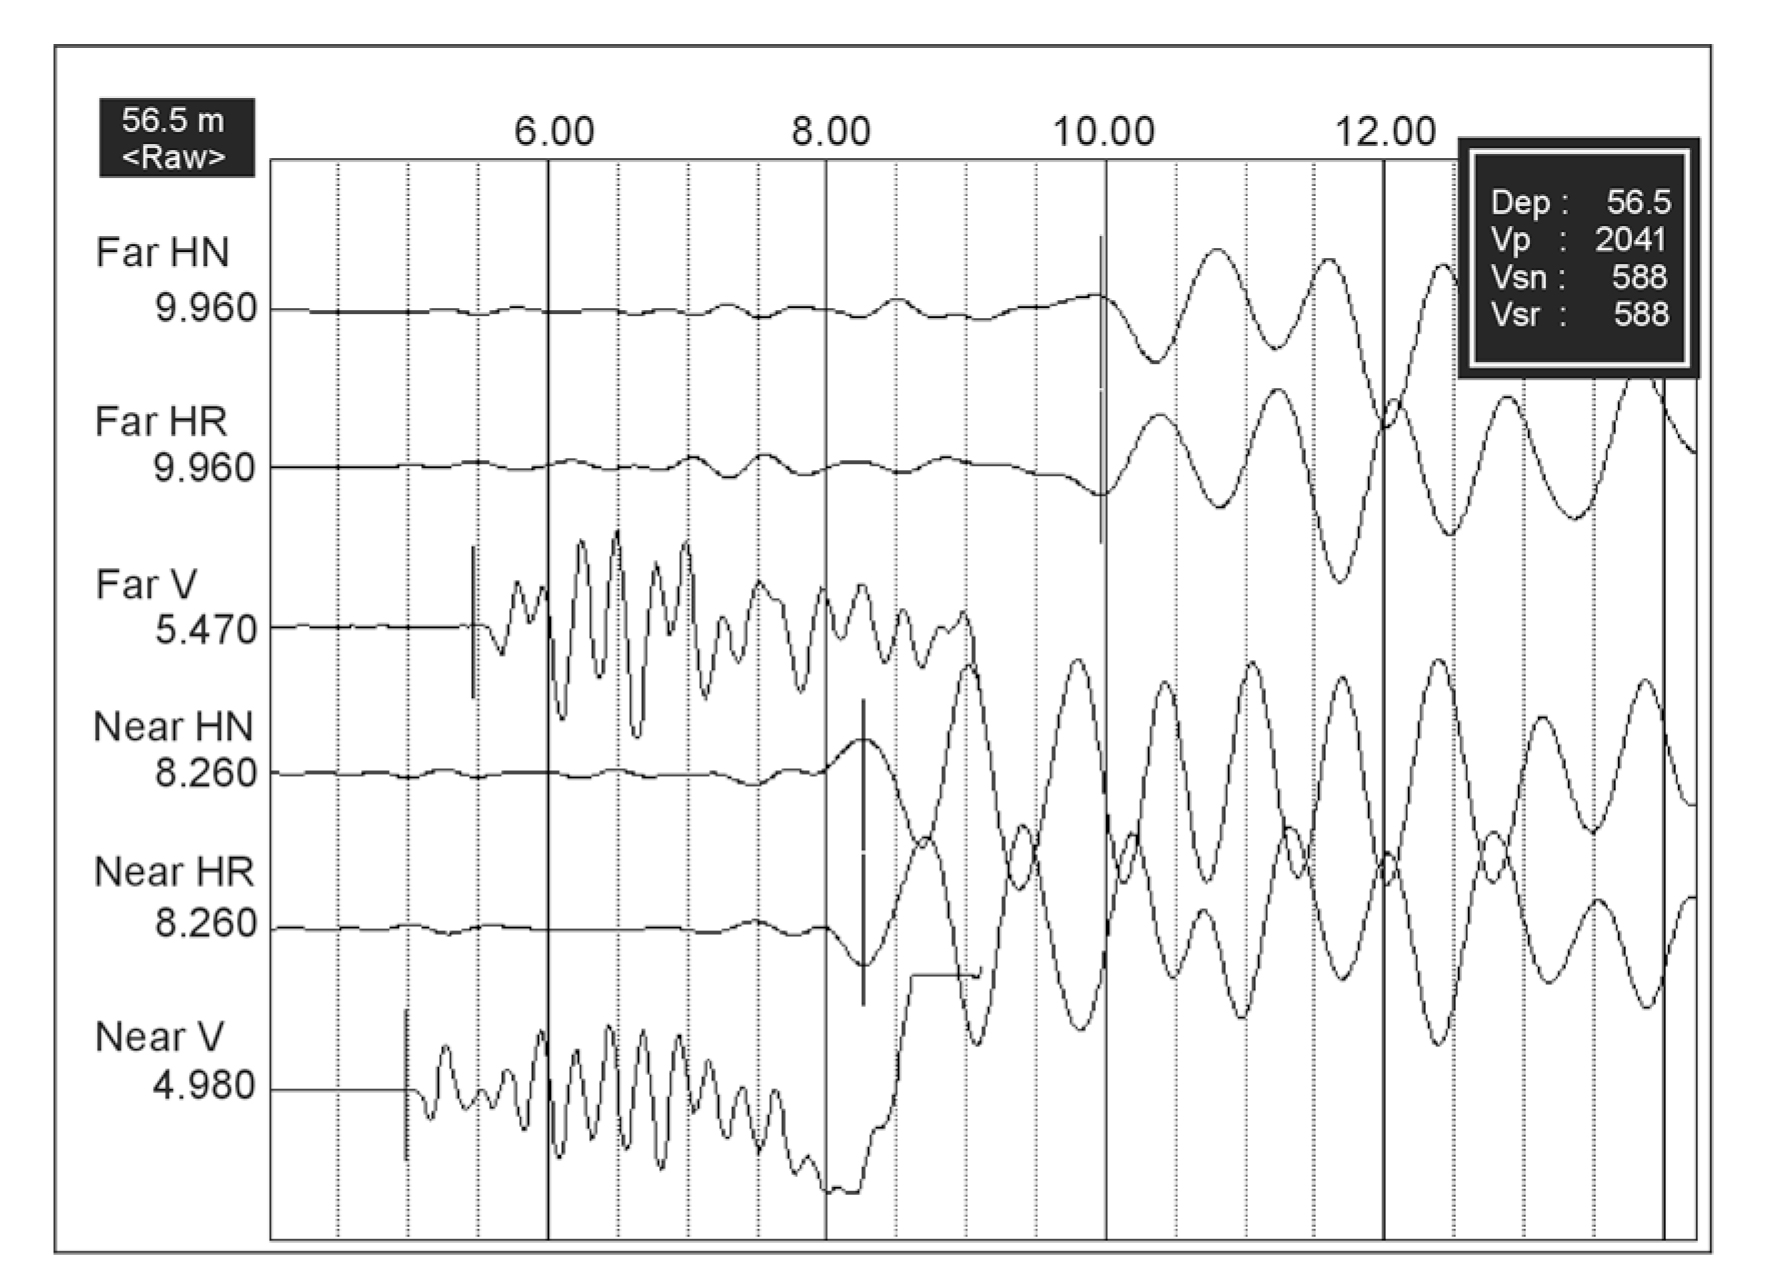
Figure 174. Sample suspension logging waveform record. (GeoVision Geophysical Services)
Limitations: Interpretation of clean suspension logging data is relatively straightforward, but poor data is often ambiguous. The data quality is heavily influenced by the borehole conditions. The best borehole conditions are achieved by drilling with the mud-rotary wash method. Borehole quality deteriorates with time after drilling. If another drilling method is used that results in a rough borehole surface, the hole is usually grouted and cased. Care must be taken to use grout that is comparable in stiffness with the native material so that good coupling between the casing, grout, and native material is achieved. PVC casing is acceptable but steel is not. Logging cased holes eliminates standby time but may result in lower quality data.
Changes to the suspension logging processing method could improve the processing of noisy data. Cross correlation could be used to determine the time lag at which the waveforms from the near and far receivers match best.
Suspension logging does not always provide excellent results in the near surface (< ~5 m depth). This is because it is difficult to generate waveforms in the surrounding soil under low confining stress. Steel conductor casing may also be present in the top of the borehole.
Integrated Logging System
Basic Concept: The integration of acoustic or optical televiewer, full waveform sonic, calibrated formation density, borehole caliper, natural gamma, and relative neutron porosity logs (figure 175) allows the geotechnical engineer to obtain dynamic soil and rock dynamic properties and geological information. These properties include bulk density, bulk modulus, Young's modulus, shear modulus, Poisson's ratio, fracture density, dominant bedding and fracturing trends, stress-strain relationships, and rock rippability.
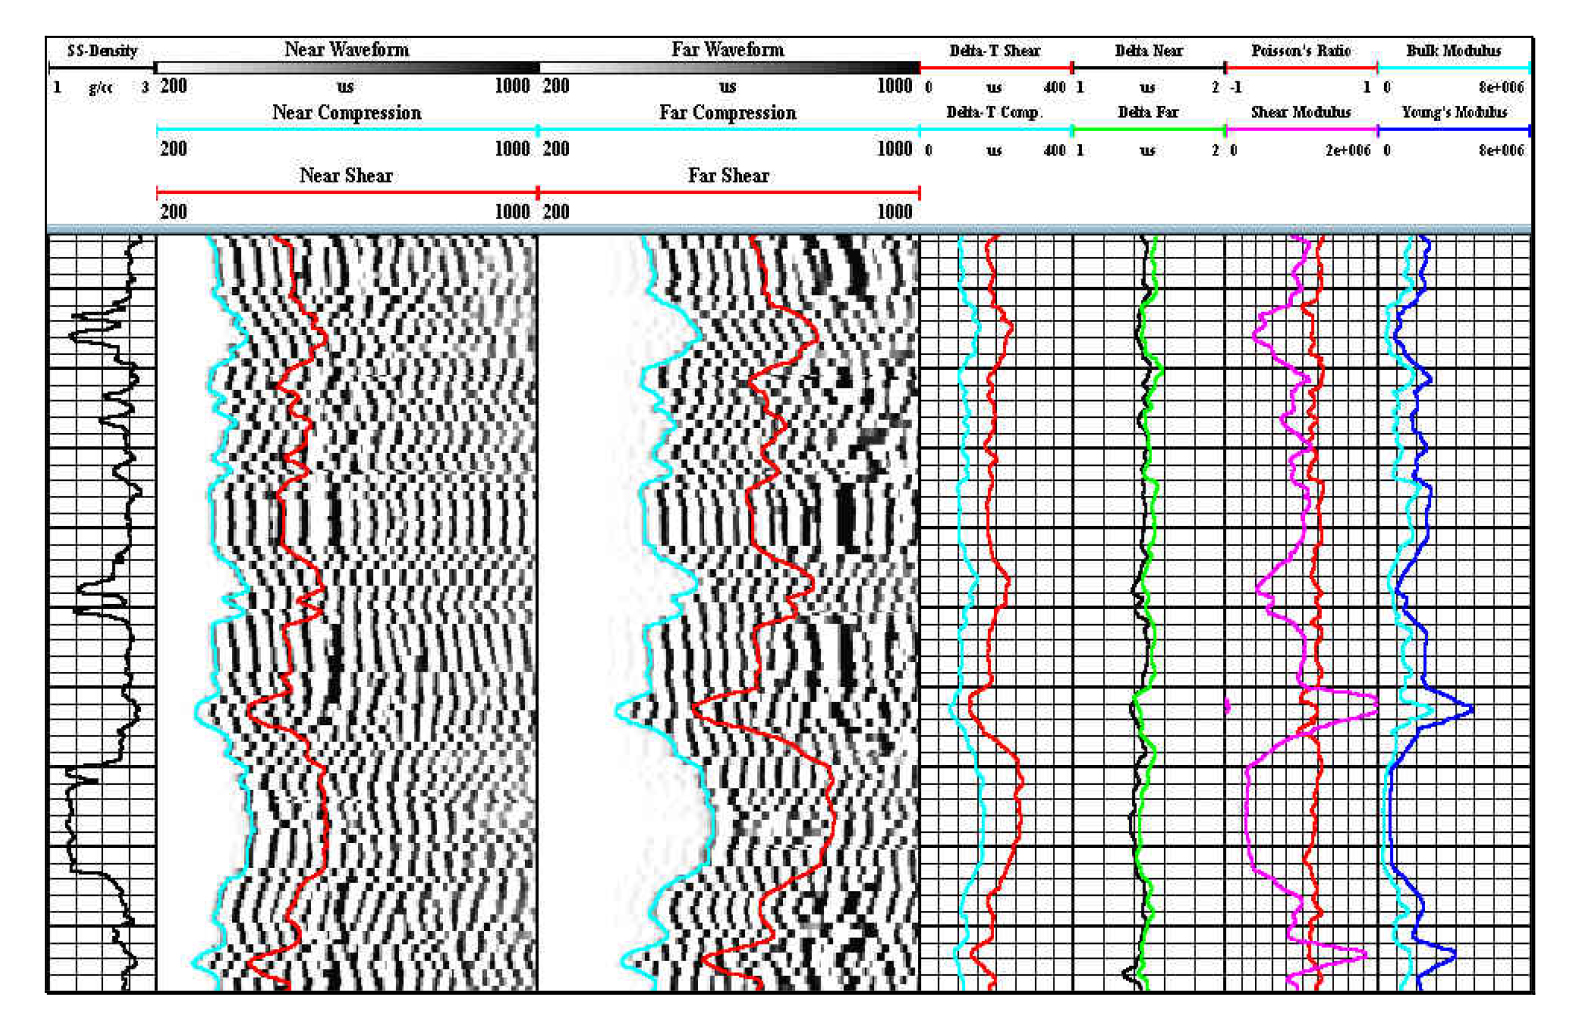
Figure 175. Examples of engineering rock property traces as calculated from density and sonic logs. (Layne Christensen, Colog)
Data Acquisition: In wireline logging operations, a truck mounted logging system is used to obtain borehole geophysical logs. In engineering rock properties applications, a minimum of calibrated multi-detector density and multi-receiver full waveform sonic logs are acquired.
Data Processing and Interpretation: In this application, sonic waveforms are initially picked for compressional and shear wave arrival times. Specialized algorithms are then applied to the density logs to compensate for borehole effects such as mud or fluid invasion, mud cake, and rugosity. Finally, P and S travel times and compensated density values are combined in obtaining bulk density, bulk modulus, Young's modulus, shear modulus, and Poisson's ratios.
Advantages: Borehole logging significantly reduces the need for core sampling and laboratory analysis by providing a continuous borehole geophysical log of in-situ properties. When combined with the fracture analysis of imaging televiewer logs, inferences can be made regarding fracture density, dominant bedding, fracturing trends, stress-strain relationships, and rock rippability.
Limitations: In rock properties applications, an open, stable borehole is required. Sonic logging requires a fluid-filled borehole. Density logging requires special handling of radioactive cesium sources.
Crosshole Shear logging
Basic Concept: The primary purpose of obtaining crosshole data is to obtain the most detailed in situ seismic wave velocity profile for site-specific investigations and material Characterization. Crosshole velocity data are valuable for assessing man-made materials, soil deposits, or rock formations.
The seismic technique determines the compressional (P-) and/or shear (S-) wave velocity of materials at depths of engineering and environmental concern where the data can be used in problems related to soil mechanics, rock mechanics, foundation studies, and earthquake engineering. Crosshole geophysical testing is generally conducted in the near surface (upper hundred meters) for site-specific engineering applications. All of the dynamic elastic moduli of a material can be determined from knowledge of the in situ density, P-, and S-wave velocity. Therefore, since procedures to determine material densities are standardized, acquiring detailed seismic data yields the required information to analytically assess a site. Low-strain material damping and inelastic attenuation values can also be obtained from crosshole surveys. However, the most robust application of crosshole testing is the ability to define in situ shear-wave velocity profiles for engineering investigations associated with earthquake engineering.
Data Acquisition: Crosshole testing takes advantage of generating and recording (seismic) body waves, both the P- and S‑waves, at selected depth intervals where the source and receiver(s) are maintained at equal elevations for each measurement. Figure 176 illustrates a general field setup for the crosshole seismic test method. Using source-receiver systems with preferential orientations in tandem (i.e., axial orientations, which complement the generated and received wave type/signal) allows maximum efficiency for measurement of in situ P- or S-wave velocity depending on the axial orientation. Due to the different particle motions along the seismic ray path, it is crucial to use optimal source-receiver systems in order to best record crosshole P- or S-waves. Because only body waves are generated in the source borehole during crosshole tests, surface waves (ground roll) are not generated and do not interfere with the recorded body-wave seismic signals. Crosshole testing are three-directional in nature. Therefore, three-component geophones with orthogonal orientations yield optimal results when acquiring crosshole P- and/or S‑wave seismic signals. With three-component geophones, there is one vertically oriented geophone and two horizontal geophones. For crosshole tests, one horizontal geophone remains oriented parallel to the axis between the boreholes (radial orientation), and the other one remains oriented perpendicular to the borehole axis (transverse orientation). In this case, the two horizontal axis geophones must remain oriented, radially and transversely, throughout the survey. This is accomplished with loading poles or with geophones that can be electronically oriented.
Data Processing: Utilizing digital recording equipment affords the operator the ability to store the data on magnetic media for analysis at a later date; but more importantly, digital data can be filtered, smoothed, and time-shifted during analysis. Also, digital signal processing may be directly performed for coherence, frequency-dependent attenuation, and spectral analysis.
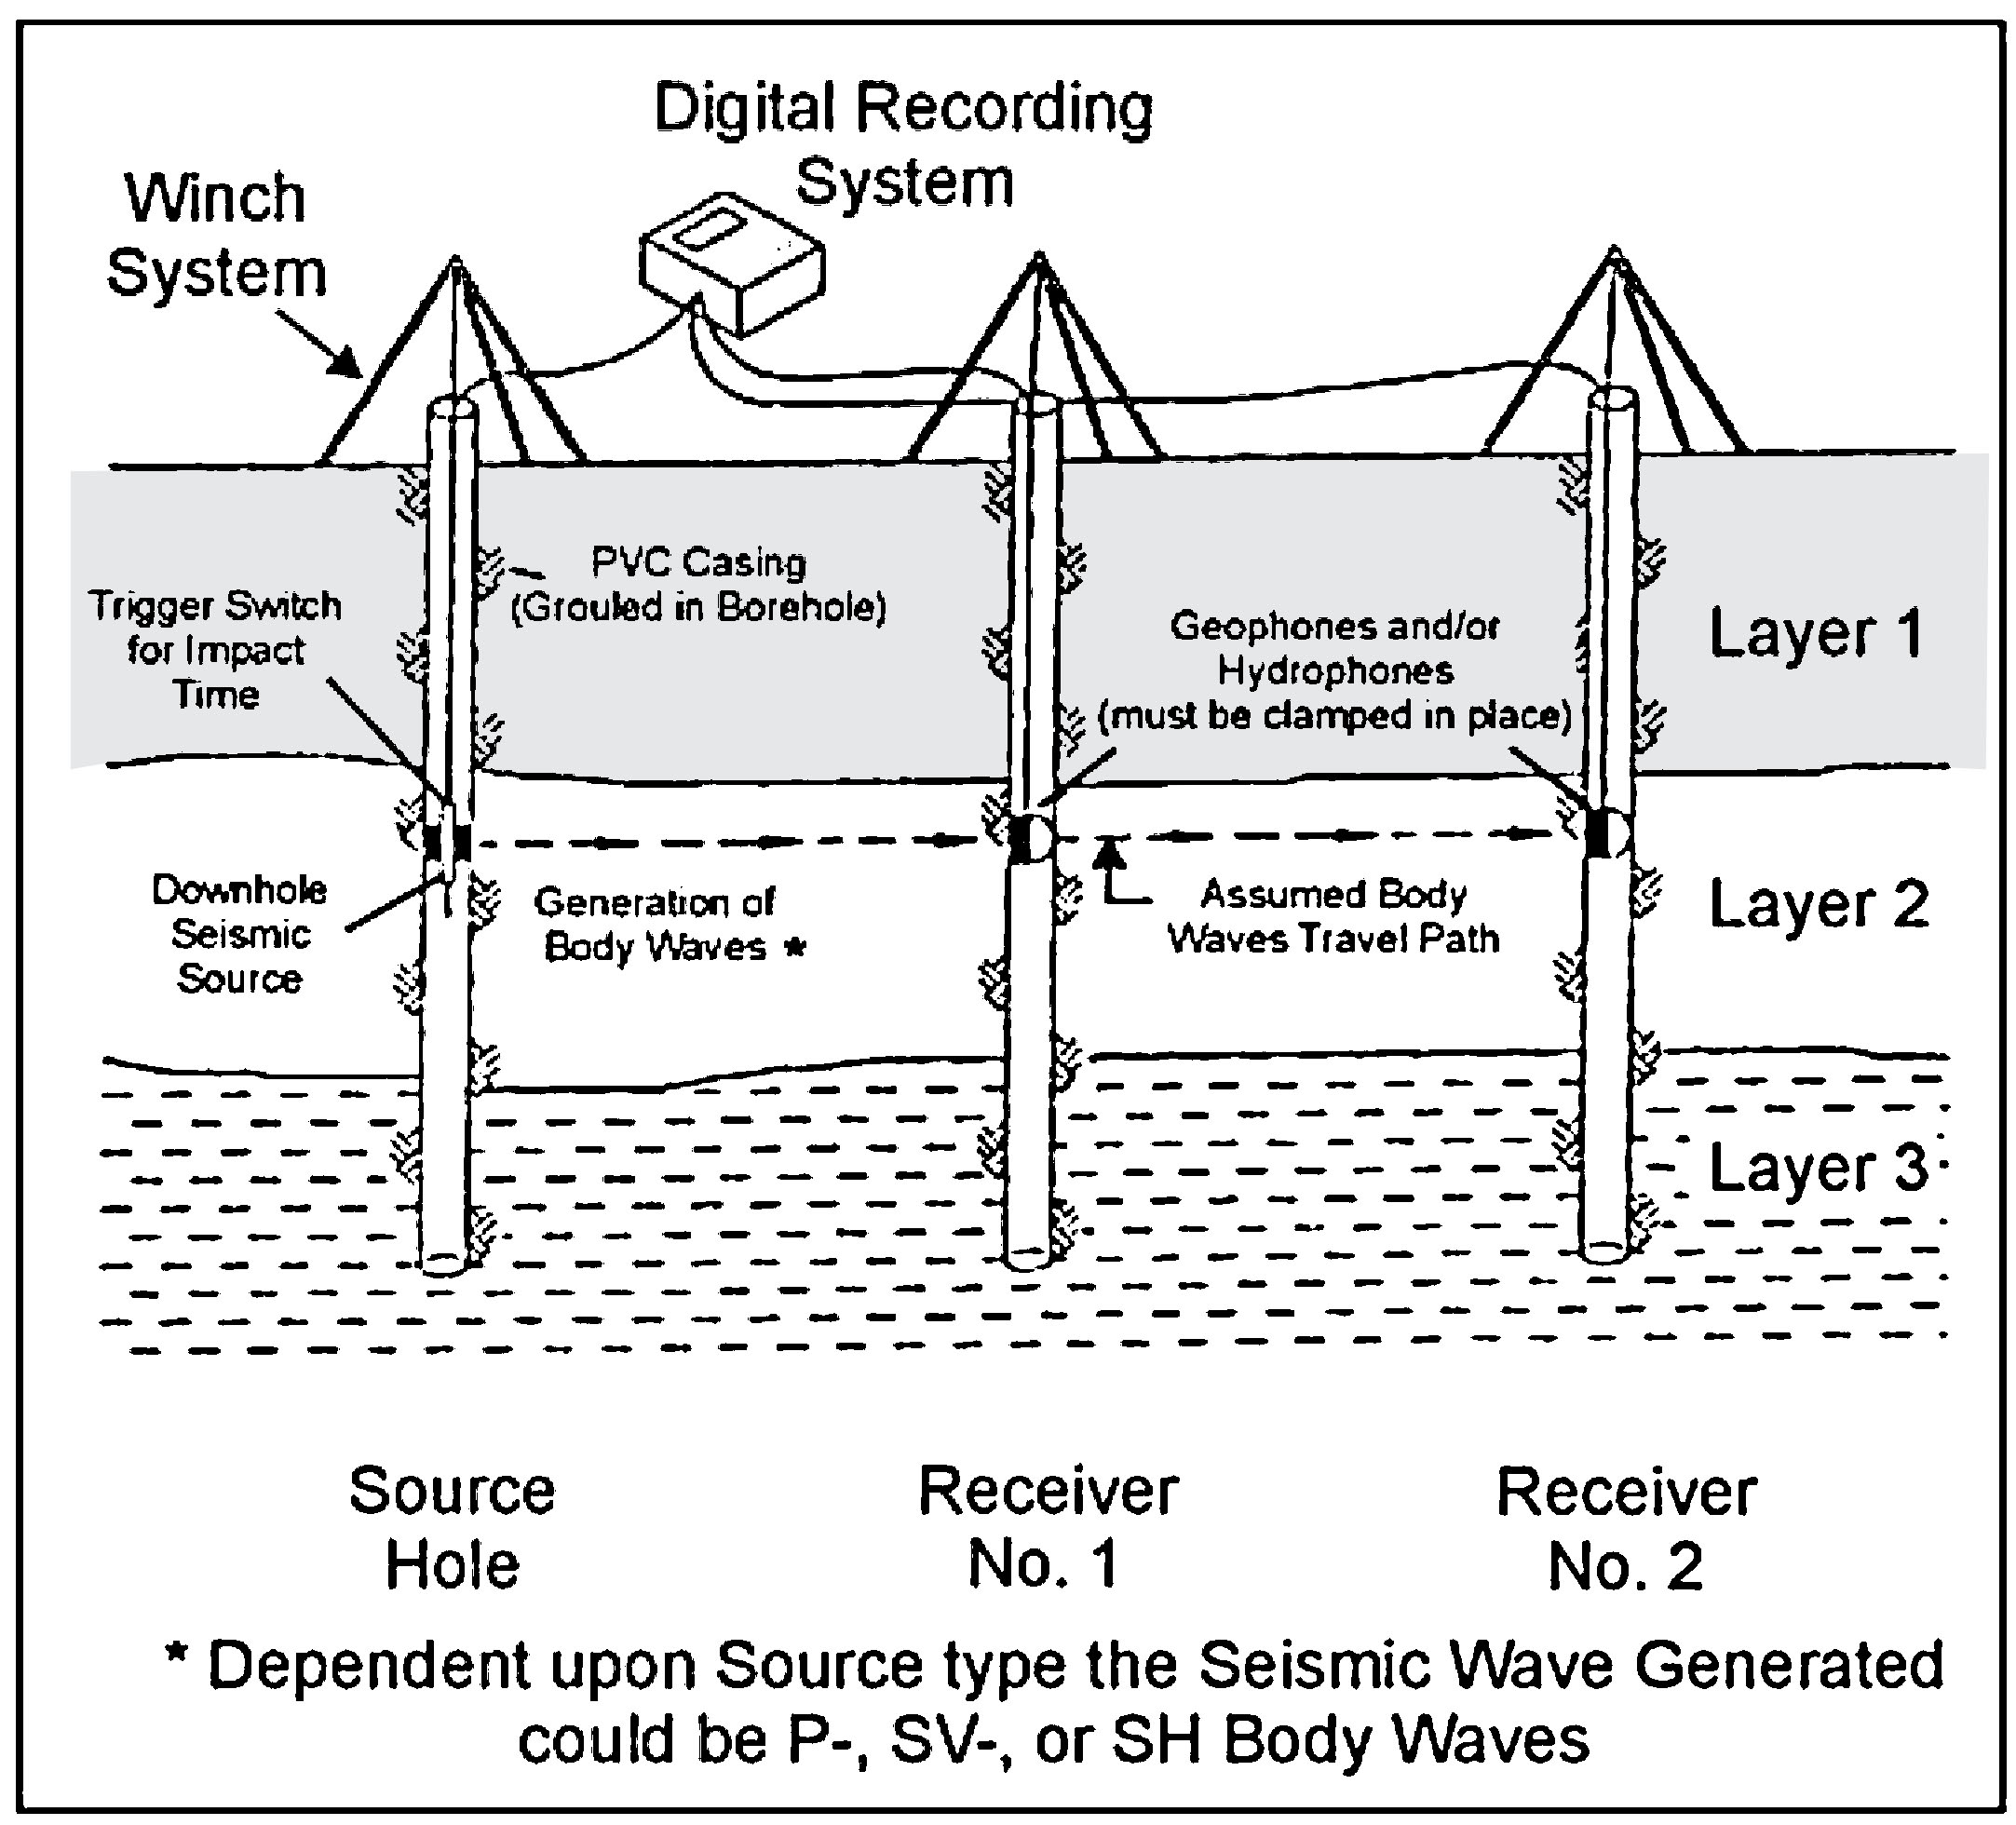
Figure 176. Schematic of crosshole method.
Data Interpretation: For interpretation of direct ray path travel times between two or three boreholes, the Bureau of Reclamation has published a computer program that is designed specifically for reducing crosshole seismic data. Furthermore, the program was fashioned around the ASTM conventions and test procedures outlined for crosshole seismic testing. The program CROSSIT (Version 2.0) is intended to be a step-by-step program that allows the user to:
- Input lithologic information obtained from geologic drill hole logs.
- Input deviation survey for each drill hole.
- Input travel times for P- and/or S-wave arrivals at one or two receiver holes.
- Enter site-specific information (location, surface elevation, etc.).
- Map each borehole using deviation survey information.
- Determine corrected crosshole distances between respective drill shot pairs:
- source/receiver 1, source/receiver 2 and receiver1/receiver2.
- Compute direct P- and S-wave velocities from travel time data.
- Tabulate and/or graph (to hard copy or disk file).
- Borehole directional survey data and plots.
- P- and S-wave velocity depth profiles from each drill hole pair.
- Interactively edit input or graphical files and combine data sets.
- Post-process seismic data and/or plots for alternative uses.
CROSSIT is built for compatibility with laptop or desktop computers and dot matrix or laser-jet printers such that data reduction could be performed in the field as geophysical data are being acquired. The logic and flowt for this interpretation and data presentation program are designed to follow the typical field data acquisition process (i.e., geologic information, borehole information, travel-time information) to permit interactive computer analysis during data collection. This technique of reducing data in the field has proven its value because of the ability to determine optimal testing intervals and adjust the program as necessary to address the site-specific problem.
Data Processing: There are a number of digital signal processing techniques useful for determining material properties other than P- or S-wave velocity, as well as confirming the computed crosshole velocity profile, such as:
Spectral analysis for determination of inelastic constants (attenuation and/or material damping).
Frequency analysis for correlation of phase and group velocity.
Cross-correlation of recorded seismic signals from one receiver to another receiver borehole, or source to receiver coupling for signal coherence.
Sophisticated processing is rarely required in (engineering) crosshole testing, and the straightforward distance/travel time relationship for velocity computations is considered functional and effective.
Advantages: Crosshole seismic testing has the unique advantage of sampling a limited volume of material at each test depth. Thus, the final result is a significantly more detailed and accurate in situ seismic (P- and/or S-wave) velocity profile. Because boreholes are required, there is the opportunity to obtain more site-specific geotechnical information, which, when integrated with the seismic data, yields the best assessment for the engineering application (liquefaction, deformation, or strong motion Characterization).
Crosshole seismic testing has the definitive advantage of assessing a complex layered velocity structure with alternating high and low relative velocities. Other surface techniques such as spectral analysis of surface waves can theoretically evaluate the high/low layered velocity structure, but due to a number of inherent assumptions associated with surface geophysical methods, several non-unique velocity profiles may be derived (from inverse modeling) without specific information about the subsurface layering at the site. Since considerable confidence can be placed on engineering scale crosshole seismic data, computation of in situ low-strain elastic constants (Shear and Young's modulus, Poisson's ratio, etc.) permits dependable assessment of geotechnical parameters for the site-specific evaluation.
Limitations: The primary detriments or obstacles encountered during crosshole testing are typically related to the placement and completion of multiple drill holes. Sites where noninvasive techniques are required due to hazardous subsurface conditions, crosshole seismic tests are not applicable because of tight regulatory procedures regarding drilling, sampling, and decontamination. However, at sites where detailed in situ P- and S-wave velocities are required, drill hole completion must follow ASTM procedures, and when unusual conditions exist (e.g., open-work gravels), specialized techniques for borehole completion should be employed. The U.S. Bureau of Reclamation has encountered numerous sites in the western United States where loose, liquefiable sand and gravel deposits needed to be investigated, and crosshole testing effectively evaluated the in situ material density and stiffness with P- and S-wave velocities, respectively; however, considerable care and caution were used for completion of each borehole.
Seismic data for crosshole testing needs considerably more waveform interpretation because refraction events from high-velocity layers either above or below a low-velocity layer must be identified and the first-arrival velocity corrected. Direct-wave arrivals are easily recognized (even with low-amplitude refracted arrivals) as long as the previously described field equipment is utilized for preferential generation of P-waves or polarized SV or SH-waves. The ASTM requirement of three drill holes seems costly to a project budget; however, the necessary source/receiver configurations and borehole separation allow optimal correction and evaluation of in situ P- and S-wave velocities for each material layer at depth.