Underground storage tanks (UST) are made from steel, fiberglass, and other materials. They range in size from fairly small tanks with capacities of less than a few hundred gallons to those with capacities of many thousands of gallons. Tanks are usually buried with their tops a few feet beneath the ground surface. Pipes and other facilities may be connected to the tanks. They are also often buried in industrial areas where a significant amount of other metal is present.
Different geophysical methods are applicable to tanks composed of different materials. For example, metal tanks (made from ferromagnetic material) can be found with magnetic, electromagnetic, and Ground Penetrating Radar (GPR) methods. Non-metal tanks can usually only be found with GPR, although electromagnetic methods may work in some cases.
Magnetic Methods
Basic Concept: A metal tank is magnetized by the Earth's magnetic field. It then produces a secondary field. The resultant field contains both the Earth's magnetic field and the field from the tank and results in a distortion of the Earth's magnetic field. A magnetometer can be used to survey an area where metal tanks are expected and should be able to locate the tanks. In addition to measuring the Earth's total magnetic field, magnetic instruments are produced with two sensors and are able to measure the gradient of the Earth's magnetic field. The gradient of the field is usually less sensitive to local interferences and may be the best method in industrial sites with significant cultural features. It may also be easier to interpret since the peak of the anomaly is over the center of the magnetic source (a tank). The total field data peaks to the south of the magnetic source and has a negative amplitude to the north of the source. Almost all magnetometers can record data to memory during the survey. This can then be downloaded to a computer for further processing if needed.
Data Acquisition: Magnetometer surveys are usually conducted along straight lines covering the area of interest. Readings are often taken at regular time intervals (say one second or faster) while walking at a reasonable pace. To position the data, either the ends of the lines will have to be surveyed or a Global Positioning System (GPS) is used. Figure 188 shows a gradiometer system measuring the horizontal gradient of the earth's magnetic field. This equipment has two gradiometers, one on either side of the operator, allowing more efficient field surveying.
Figure 189 shows a magnetometer system with a GPS unit attached to give the coordinates of the survey.
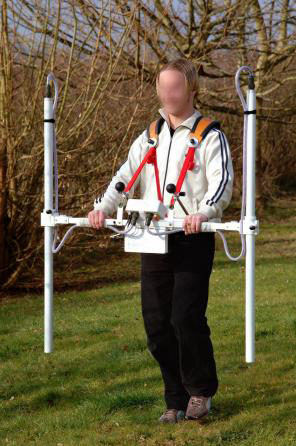
Figure 188. Magnetic gradiometer system. (Bartington Instruments)
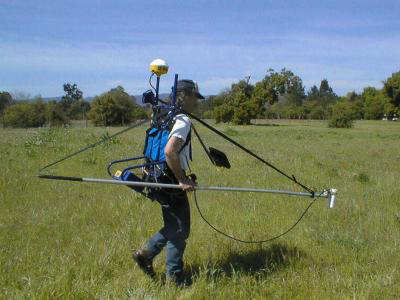
Figure 189. Magnetometer with Global Positioning System. (Geometrics, Inc.)
The Earth's magnetic field continuously changes strength and has a daily cycle, called the diurnal variation. If the survey takes more than a few hours, or significant magnetic field changes are occurring, a base station should be used. The base station is set up at a location close to the investigation site where no magnetic anomalies are present. The base station records the magnetic field strength at regular intervals along with the time of the reading. The instrument used to conduct the survey also records the time that each reading is taken. Thus, it is possible to remove the influence of diurnal changes from the field data. Removal of the diurnal effect is not required with gradient magnetic data, since the diurnal changes affect both sensors simultaneously. However, surveys for UST's are likely to be completed fairly quickly, and moderate to large anomalies are often encountered; thus, the base station corrections will not usually significantly influence the data.
Data Processing: As mentioned above, probably the most important item is to remove the influence of diurnal changes in the Earth's magnetic field. Coordinates have to be assigned to the data so that maps can be drawn. This requires that the ends of the traverse lines are surveyed, or a GPS system is used o position the data. The data can be filtered if needed, although little processing is typically required for this application.
Data Interpretation: Interpretation of magnetic data for tanks usually involves visual inspection of the data for anomalies that suggest tanks. These are then located on a map of the area. Since magnetometer surveys are very simple, they can be used as a rapid screening tool. Magnetic data can be interpreted using modeling software providing estimates of the size and depths to the sources of the magnetic anomalies, if required.
Advantages: The magnetic method provides a simple way to locate metallic underground storage tanks. Since the data is observed while conducting the field survey, anomalies can be located and marked on the ground at the time of the field survey if the results are relatively straightforward with little interference from above ground or below ground ferromagnetic objects.
Limitations: The method requires the tank be constructed of ferromagnetic metal. If a significant amount of local surface metal exists, it may be difficult to separate anomalies from the surface metal from those emanating from buried tanks. This can be a significant problem in some industrial areas. Magnetic data should not be recorded if the diurnal magnetic field variations are large, depending on the expected size of the anomaly and the duration of the survey. However, since the target for these surveys are tanks made from ferromagnetic material, which should produce very large anomalies, and the surveys will generally be completed in a short amount of time, this should not be a serious limitation.
Electromagnetic
Basic Concept: Electromagnetic (EM) methods are commonly used to locate buried tanks. They use a transmitter (coil) to produce an electromagnetic field, which then induces electrical currents in electrically conductive material. The amount of current induced depends on the electrical conductivity of the material. Since metal is highly conductive, relatively large currents are induced in metal objects. These currents then generate a secondary electromagnetic field that can be detected at the ground surface using a receiver coil. The final output from the receiver coil is a voltage related to the conductivity of the material influenced by the electromagnetic field from the transmitter. Electromagnetic instruments can locate both ferrous and non-ferrous objects.
There are two kinds of electrical signals used by electromagnetic equipment. One is called Frequency Domain, and the other is called Time Domain. Frequency domain signals are sinusoidal electromagnetic signals, and for geophysical equipment, usually have frequencies below 10 kHz. Time domain signals occur when the transmitter current is switched on for a short time and then switched off. This procedure is repeated continuously. When the current switches on or off, the rapid change in the transmitter current and corresponding electromagnetic field produces currents in local conductive material. As with frequency domain signals, the amount of current induced depends on the conductivity of the material. These currents then generate a secondary electromagnetic field, which is detected by the receiver coil during the time that the transmitter current is off.
Figure 190 presents a conceptual drawing showing the different current and electromagnetic fields involved.
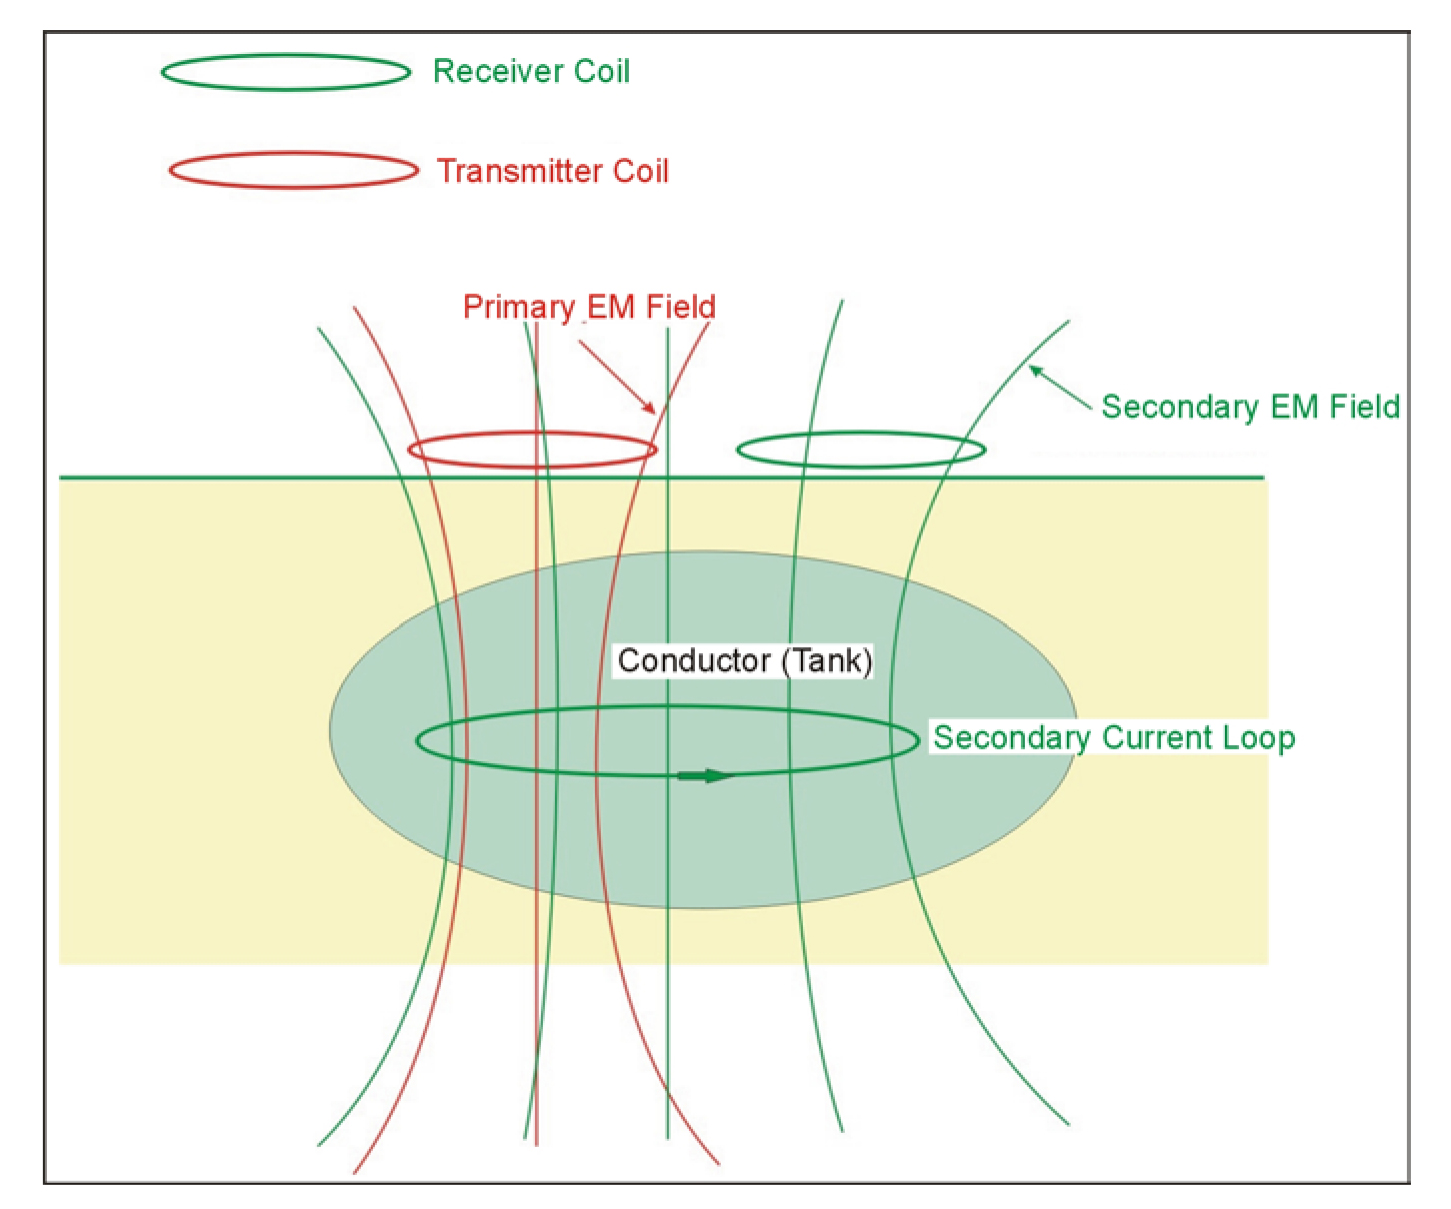
Figure 190. Concept diagram for electromagnetic methods.
In the above diagram, the transmitter generates an electromagnetic field using electrical current in the transmitter coil (shown in red). This electromagnetic field then creates currents in conductors (shown in green). These conductors then generate secondary magnetic fields (shown in green) that are detected by the receiver coil. The receiver coil then outputs a voltage that indicates the conductivity of the object.
Several electromagnetic instruments can be used to find buried tanks. These include the EM31 and the EM61, manufactured by Geonics Ltd. of Canada, and the GEM2 manufactured by Geophex USA. The EM31 and GEM2 are frequency domain instruments, whereas the EM61 is a time domain instrument. Generally, these instruments have a depth of investigation of 4 m or more, depending on the target size and the local conditions. Figure 191 shows the GEM2 instrument.
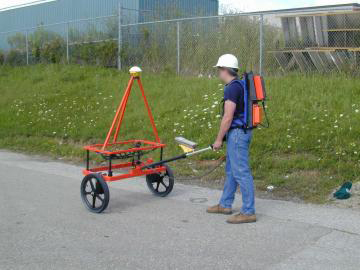
Figure 184. The EM61-MK2 instrument. (Geonics, Ltd)
Figure 184 shows the EM61 in use. The lower coil is the transmitter and data are recorded using both the lower and upper coils. Since surface metal influences the lower receiver coil more than the upper receiver coil, having two receiver coils allows the influence of surface metal to be minimized.
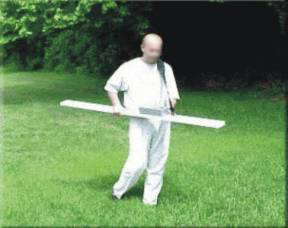
Figure 191 The GEM2 electromagnetic instrument. (Geophex Inc.)
A hand-held EM61, shown in figure 185, is also available and is useful when the larger EM61 is too cumbersome for use in the area to be surveyed.
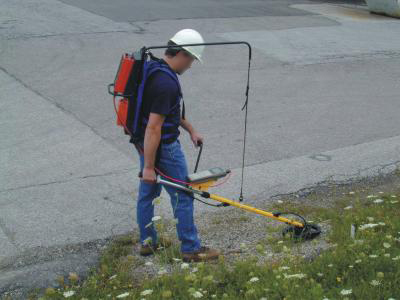
Figure 185. The EM61-HH2 hand held instrument. (Geonics, Ltd.)
Data Acquisition: Electromagnetic surveys for tanks are conducted in much the same manner as magnetic surveys for tanks. Lines are laid out crossing the area of interest and data are recorded along these lines.
Data Processing: Electromagentic data are recorded and downloaded to a computer, and contour maps produced of the data. The data can be filtered if needed, but this is probably not common. The data can have coordinates assigned if the magnetic traverses have been surveyed or a GPS system was used.
Data Interpretation: Areas of buried metal will produce strong anomalies in the EM data that can be recognized in the generated contour maps. With he EM61, the shape of the anomaly generally matches the shape of the buried metal object and USTs can generally be recognized based on the shape.
Advantages: The instruments described above provide a good method for locating underground storage tanks. If the geophysical instruments are used then the data can be downloaded to a computer and plotted to provide a record of the survey.
Limitations: Probably the most significant limitation of the EM31, EM61, and GEM2 instruments is the influence of local metal at the site. In addition, highly conductive soils may limit the effective penetration of these instruments. Of these instruments, the EM61 is least influenced by local metal. By using data from the two receiver coils, this influence can be minimized.
Metal Detectors
Basic Concept: Metal detectors use the same principles as do the geophysical instruments described above. However, they are generally smaller instruments and are easier to use, although their investigation depths will often be smaller. Some metal detectors use magnetic sensors and others use electromagnetic waves. The magnetic metal detectors often use two sensors and measure the gradient of the magnetic field. Figure 192 shows a drawing of two sensors and the magnetic field lines from a buried object.
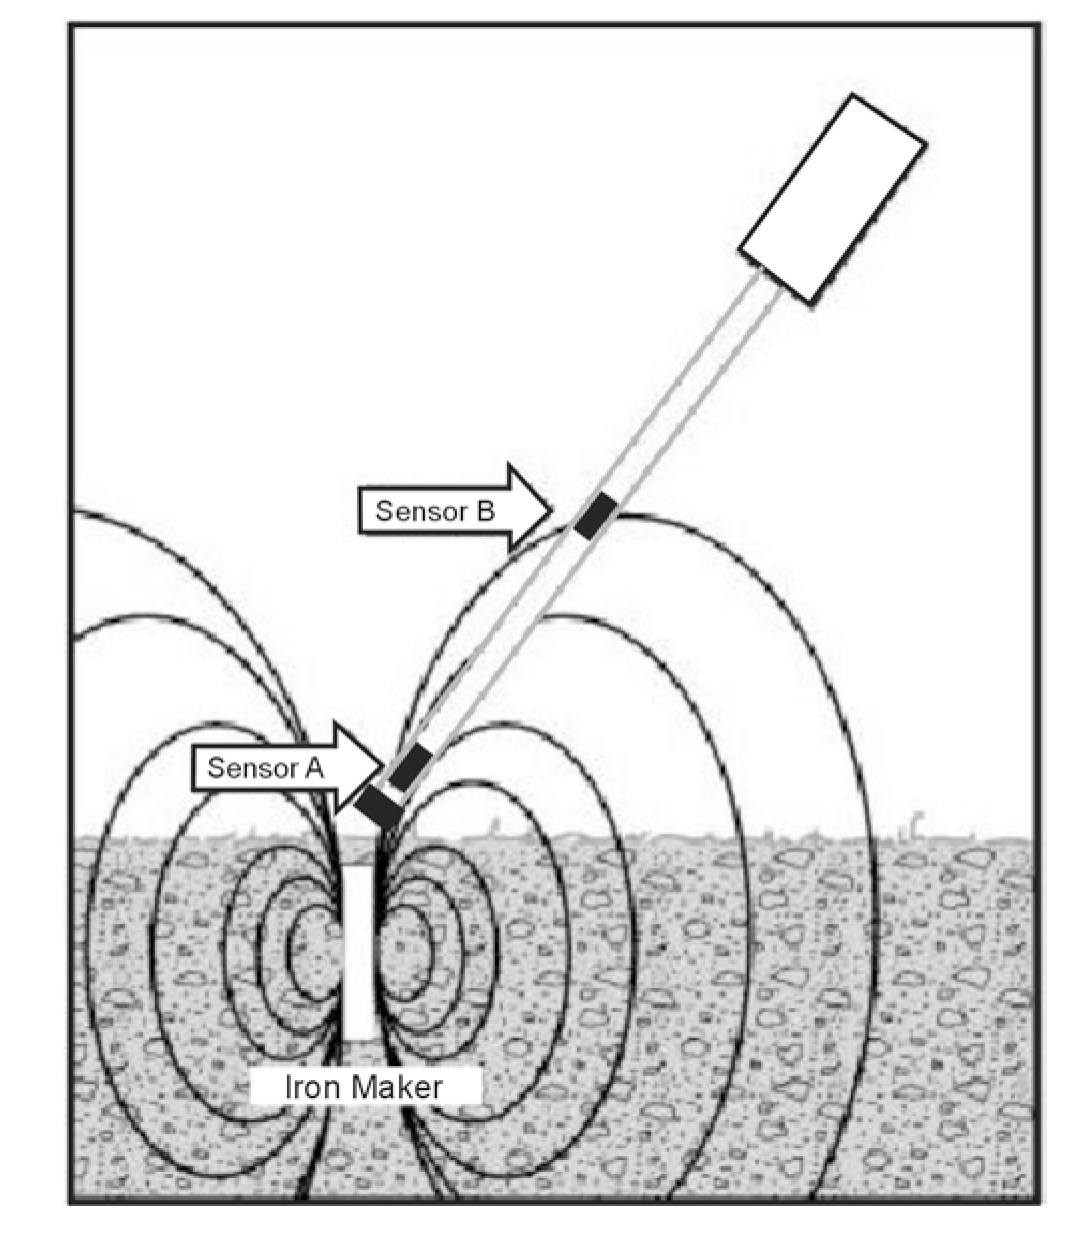
Figure 192. Metal detector using two magnetic sensors.
Metal detectors that use electromagnetic methods use a wide range of frequencies (500 Hz to over 80 kHz) producing sinusoidal electromagnetic waves to produce secondary electrical currents in the targets. These secondary currents then produce secondary electromagnetic fields that are sensed by the metal detector.
Metal detectors, also called pipe and cable detectors, are widely used at UST sites for locating buried metal objects. The depth of investigation of metal detectors is dependent primarily on the surface area and depth of the object. However, the response of an object decreases rapidly as depth increases. However, metal detectors can detect a 55-gallon drum to depths of 3 m and a 10,000-gallon tank up to 6 m. Metal detectors are particularly useful for tracing pipes and cables at UST sites. These detectors are less sensitive to surface and subsurface interferences than the larger geophysical EM instruments, although care must be taken to minimize noise from fences, vehicles, buildings, and buried pipes. In addition, these instruments are less influenced by the conductivity of the soil than EM instruments. However, mineralized soils and iron-bearing minerals can provide significant natural interference.
Data Acquisition: Surveys are conducted by sweeping an area and listening (for those with audio signals) or observing the signal magnitude for anomalies. These locations are then marked on the ground as the survey progresses.
Data Processing: Usually, no processing of the data can be done with a metal detector.
Data Interpretation: Metal detectors provide visual or audio display that is viewed in the field. Anomalies are usually marked on the ground as they are observed.
Advantages: Metal detectors are usually easy to use and provide anomaly information as the survey progresses.
Limitations: Since metal detectors do not usually store field data in memory, no record of the results, and anomalies, can be made.
Ground Penetrating Radar
Basic Concept: Ground Penetrating Radar (GPR) is a technique that uses high frequency radar waves to image the subsurface. Ground Penetrating Radar (GPR) can be used to locate buried tanks and utilities. The depth of investigation of GPR depends on the soil conditions. A saturated soil with significant clay will severely limit the effective penetration of the GPR signal. Ideal conditions are unsaturated, clay-free soils. Depth of penetration also depends on the frequency of the signal. Different antennas provide different frequencies, which range from about 25 MHz to 2700 MHz. A low-frequency antenna (signal) will provide the best penetration depth. Since resolution, which is better with a high-frequency antenna, is usually not a serious issue for UST's, a low-frequency antenna is probably sufficient.
The GPR equipment consists of a recorder and a transmitting and receiving antenna (see figure 193). The transmitter provides the high-frequency sinusoidal electromagnetic signals that penetrate the ground and are reflected from objects and boundaries providing a different dielectric constant from that of the overburden. The reflected waves are detected by the receiver and stored in memory.
This figure shows the GPR signal being transmitted into the ground. In this figure the tank is reflecting the GPR signal.
Several companies manufacture GPR equipment. These include Geophysical Survey Systems, Inc (GSSI), GeoRadar, Inc, Mala GeoScience, and Sensors and Software Inc. Figure 194 shows a GPR system manufactured by GeoRadar.
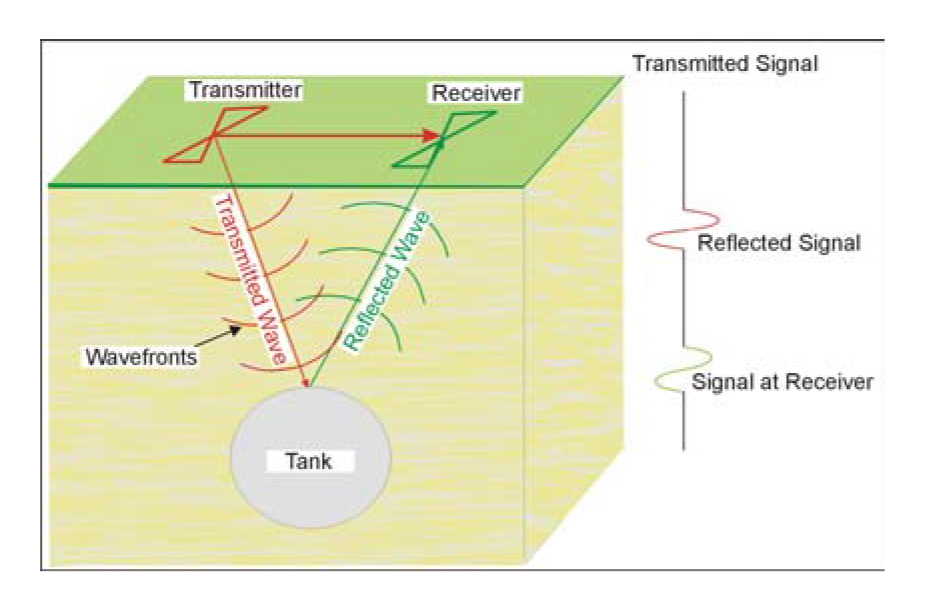
Figure 193. Ground Penetrating Radar over a tank.
Figure 113 shows a 100 MHz antenna being used during a survey. This antenna is manufactured by GSSI and requires one of their control units for use. The 100 MHz antenna is suited for deeper applications to depths of about 20 m and may be appropriate for locating UST's.
Data Acquisition: GPR surveys are conducted by pulling/pushing the antenna across the ground surface at a normal walking pace across an orthogonal grid. The recorder stores the data as well as presents an image of the recorded data on a screen. If maps are to be produced, the coordinates of the ends of the lines need to be surveyed.
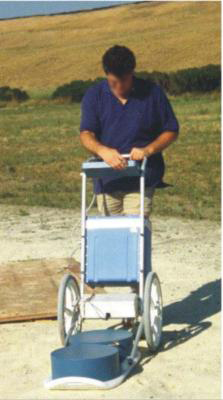
Figure 194. Ground Penetrating Radar instrument . (GeoRadar, Inc).
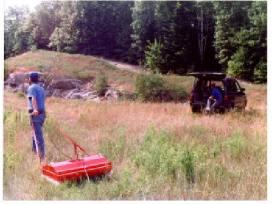
Figure 113. Ground Penetrating Radar antenna (100 MHz) used in a survey. (MALA GeoScience)
Data Processing: It is possible to process the data, much like the processing done on single-channel reflection seismic data. Processes that can be applied include distance normalization, horizontal scaling (stacking), horizontal and vertical filtering, velocity corrections and migration. However, depending on the data quality, this may not be necessary since the field records may be all that is needed to observe the target.
Data Interpretation: If the depth to an anomaly is required, the speed of the GPR signal in the soil at the site has to be obtained. This can be estimated from using propagation speeds for typical soil types or it can be obtained in the field by conducting a small traverse across a buried feature whose depth is known. Figure 195 shows three fiberglass tanks found using the GeoRadar instrument.
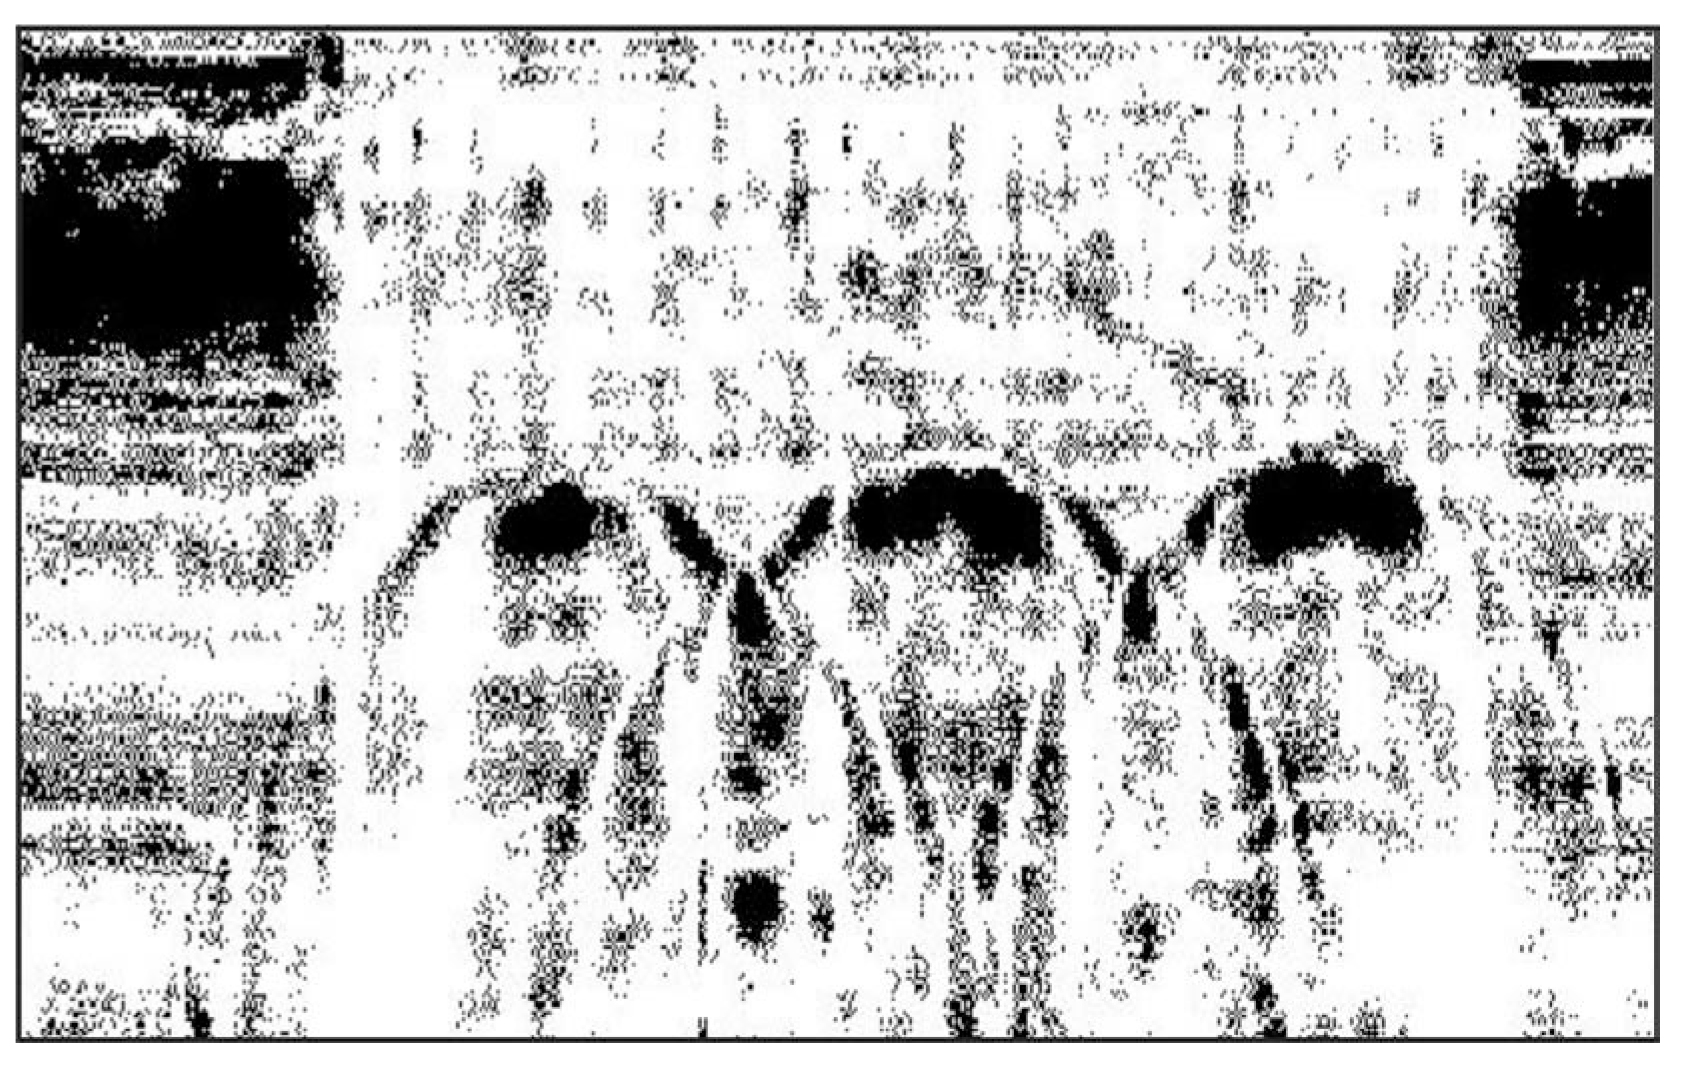
Figure 195. Ground Penetrating Radar images over three Underground Storage Tanks (UST). (GeoRadar, Inc.)
This image provides much more information than simply the location of the underground storage tanks (UST). The darker images on either side of the tanks represent undisturbed soil. As can be seen, the excavation into which the tanks were placed has vertical sides. A concrete slab has been placed on the ground surface above the tanks. This slab has rebar reinforcing, which is clearly seen as the regular vertical dark lines above the image of the tanks. The dark areas near the top of the tanks may represent air above the liquid in the tanks. Metal tanks provide an even clearer signal since they provide a large dielectric contrast with the surrounding soil. Figure 196 shows the GPR image from three tanks.
Advantages: GPR surveys are fairly easy to conduct and provide the results during the field survey. Different antenna can be used providing different frequencies if better anomaly resolution or greater penetration depth is needed.
Limitations: Probably the most limiting factor for GPR surveys is that their success is very site specific and depends on having a contrast in the dielectric properties of the target compared to the host overburden along with sufficient depth penetration to reach the target. However, it is likely that most UST's will provide the desired dielectric contrast needed; thus, depth of penetration is probably the most important factor. Tanks are usually buried with their tops a few feet beneath the ground surface. Unless there are significant amounts of clay in the soil above the tank, or heavy reinforcing metal bar, penetration to at least the top of the tank should be possible in most cases.
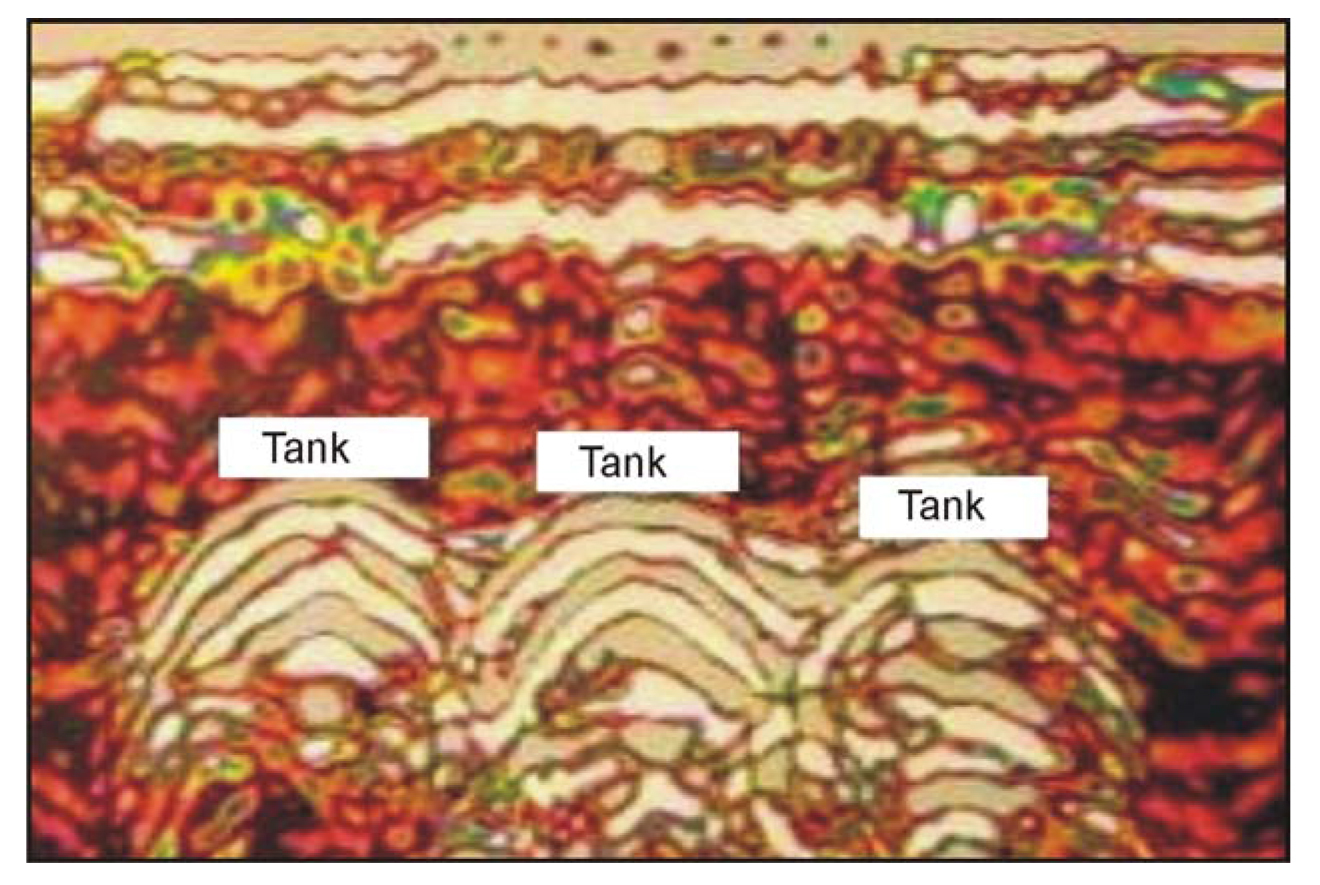
Figure 196. Ground Penetrating Radar signal from three Underground Storage Tanks. (Geomodel, Inc.)
Low-frequency antennas are usually not shielded. Thus, they radiate electromagnetic fields in all directions. If these fields encounter aboveground objects, they will produce reflections in addition to those resulting from buried objects. Sometimes the combination of reflections from above ground and subsurface objects makes the interpretation of the radar data difficult.