Unexploded ordnance exists at current and former sites where the military has used an area for target practice or other activities. The ordnance range from 20 mm projectiles to air-dropped bombs having weights of 454 or 907 kg. Depths of burial range from a few centimeters to a several meters for the air-dropped bombs. However, the vast majority of items are found to lie within one meter of the ground surface.
These areas are usually large and require a sustained and methodical approach to adequately cover the area. If the area is spatially fairly small, then a different approach may be warranted. The techniques used to search for UXO are mostly magnetic and electromagnetic methods. Both ground and airborne magnetic and electromagnetic systems are used. Other techniques used on a more limited extent include Ground Penetrating Radar (GPR) and airborne Synthetic Aperture Radar (SAR).
Positioning of the data is very important for UXO surveys, especially where a survey is completed and then an excavation teams return later to excavate and remove the ordnance. Positioning is usually done using high precision Global Positioning System (GPS) where centimeter-level accuracy can be obtained under ideal conditions.
Table 9 shows the depths for various ordnance at which electromagnetic and magnetic methods can detect them.
In addition to the geophysical methods mentioned above, there are other techniques based more on physics than geophysics. These methods will be mentioned for completeness but will not be discussed in detail. Each of the geophysical methods used for UXO exploration will be discussed below.
Table 9. Ordnance penetration and detection using magnetic and electromagnetic methods.
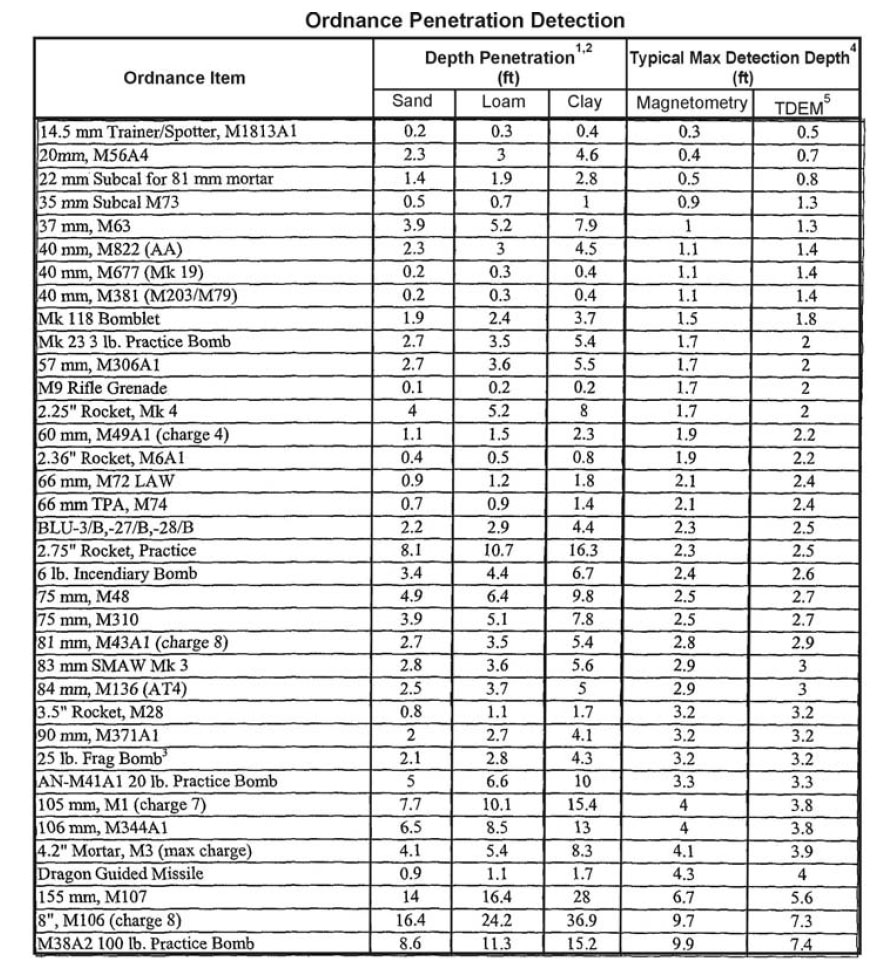
1 Penetration depths include the following "worst case" conditions assumptions: impact
velocity is equal to maximum velocity of round; impact is perpendicular to ground surface; munition
decelerates subsurface in a straight line, munition does not deform upon impact. Typical penetration
depth for any individual usually be significantly less.
2 Maximum depth of penetration assuming a velocity of 500 fps.
3 All bombs are assumed to have an impact velocity of 1135 fps.
4 Actual detection depth may vary based on field conditions and be either lower or deeper.
5 Time Domain Electromagnetics Methods
Methods
Magnetic
Basic Concept: Magnetic methods are appropriate for UXO composed of or including ferromagnetic materials. The Earth's magnetic field induces a secondary magnetic field in ferromagnetic objects. This secondary field distorts the Earth's magnetic field around the object. Magnetometers measure the intensity of the total magnetic field, which is about 35,000 nT (nano Tesla) at the equator and 60,000 nT at the magnetic poles. Distortions to this field may be only fractions of one nT for small ordnance to tens or hundreds of nT for large ordnance. The anomaly magnitude decreases with distance from its source. The decrease depends on the size of the object relative to the height of the sensor, but for a small object, will decrease as the inverse square of the distance from the source (ordnance). Thus, the amplitude of an anomaly decreases rapidly with distance from the source. The Earth's magnetic field intensity is continuously changing, usually by only a few nT per hour, often called the Diurnal (daily) drift. However, sometimes the field intensity can change by tens or hundreds of nT per hour during magnetic storms. This effect has to be accounted for during processing of the magnetic data.
There are numerous kinds of magnetometers including cesium, potassium, proton precession, fluxgate, fiber optic, and Superconducting Quantum Interference Device (SQUID). Probably the most common types in use for UXO search are the cesium and potassium magnetometers. Figure 209 shows a cesium magnetometer with a GPS system for positioning.
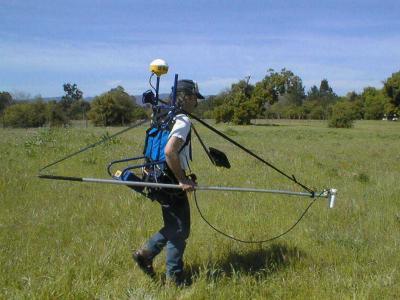
Figure 209. Cesium magnetometer with GPS. (Geometrics, Inc.)
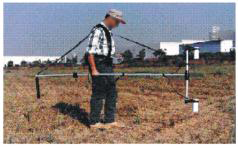
Figure 210. Gradiometer using two cesium sensors. (Geometrics, Inc.)
In addition to measuring the total magnetic field strength using one sensor, the gradient of the magnetic field is also measured using two sensors spaced a nominal distance apart. This instrument is called a gradiometer. Figure 210 shows a gradiometer using two cesium magnetometer heads. Since the sensors are arranged one above the other vertically, the instrument would measure the vertical gradient if used as illustrated.
Measuring the vertical magnetic gradient has two advantages. The first is that the output data are much less affected by diurnal drift, and the second is that the vertical gradient peaks over the top of a magnetic source whereas the total magnetic field anomaly does not. Figure 211 shows the total magnetic field and vertical gradient from a spherical object magnetized by the Earth's field. However, the depth of investigation of the vertical gradient method is less than that with the total magnetic field.
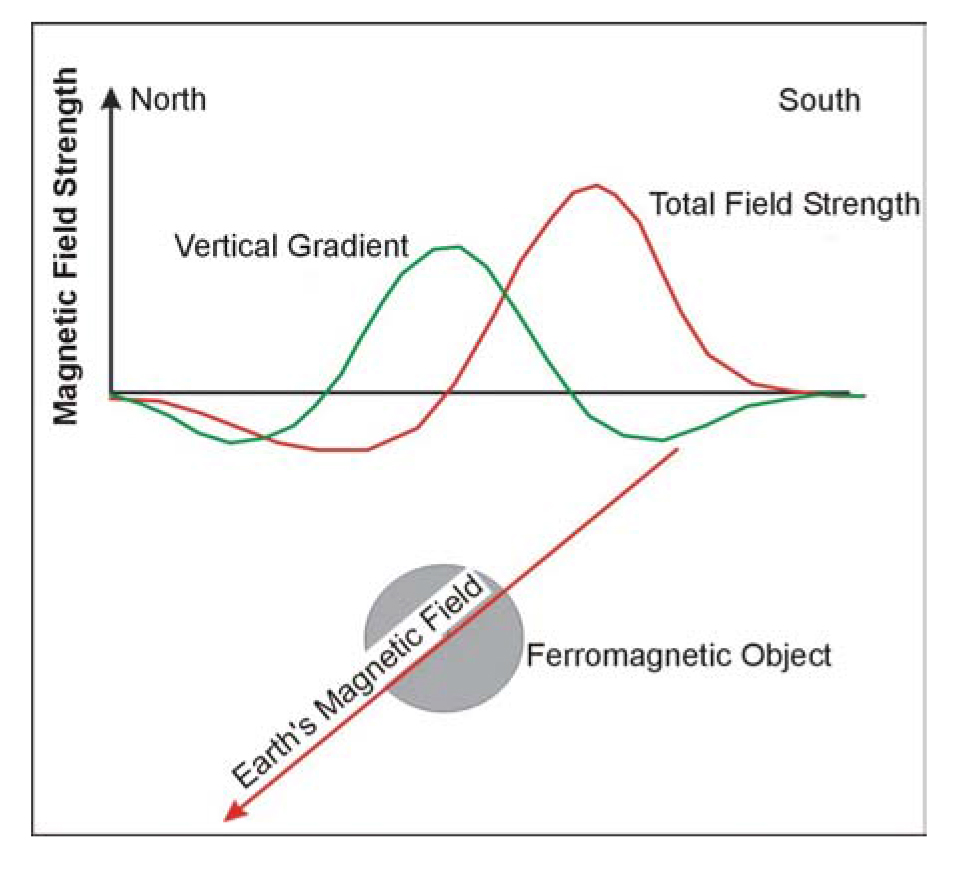
Figure 211. Total magnetic field strength and vertical gradient anomalies.
In addition to hand-held magnetometers, such as those discussed above, magnetic sensors are now assembled on drones or on frames with wheels. One such system is shown in figure 212.
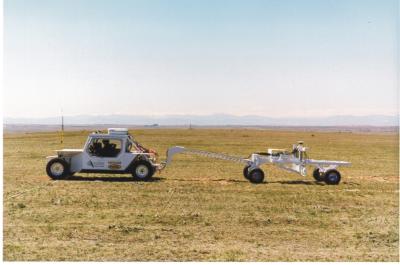
Figure 212. The MTADS UXO detection system. (Blackhawk GeoServices, Inc.)
MTADS is an acronym for Multi sensor Towed Array Detection System. The sensor array is mounted on a non-magnetic structure and is towed by a special vehicle constructed to minimize its magnetic field. The system includes GPS allowing positioning to within a few centimeters. The system can be configured to measure either the magnetic field, the vertical magnetic gradient or with electromagnetic sensors. An on board computer controls the data acquisition and stores the data in memory. A similar system is called Surface Towed Ordnance Locator System (STOLS) and is shown in figure 213.
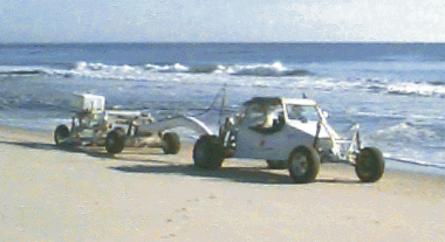
Figure 213. STOLS UXO detection system. (Geocenters, Inc.)
In addition to the above equipment, all of which stores data in memory for later downloading and processing, there are hand-held instruments that do not store the data and are used to locate anomalies that are marked in the field during the survey. One of these instruments is called a Schonstedt gradiometer. One gradiometer manufactured by the Schonstedt is shown in figure 179.
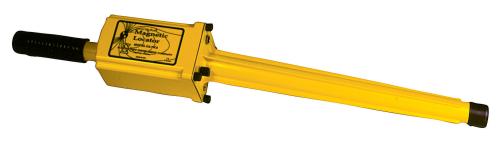
Figure 179. Magnetic location instrument. (Schonstedt Instument Company)
Data Acquisition: Magnetometer surveys for UXO must provide coverage of the area of interest with as near to 100% subsurface coverage as possible. Data is normally recorded along lines crossing the area. Surveyors paint markings are sometimes used to mark the lines that have been surveyed.
Prior to data recording, the instruments are checked each morning to ascertain that they are functioning properly. In addition, the GPS system is checked. Tests are conducted to determine the amount of time between the GPS sensor taking a reading and the reading being logged with a time stamp in the computer, called the latency of the system. Latency also takes into account the time interval between GPS readings. With the MTADS system, when recording data traveling a few kilometers per hour and attempting to position anomalies to within a few centimeters, latency is an important correction to apply. Latency is less of a problem for hand-held magnetic surveys, where data are recorded at walking speed.
A magnetic base station must also be set up to record the diurnal variation in the Earth's magnetic field. This instrument and the magnetometer recording the field data must be time synchronized so that the time when the diurnal field is measured by the base station corresponds to the time the data is recorded by the field magnetometer. Magnetic data are also collected using airborne surveys. Figure 214 shows a helicopter-mounted magnetometer system.
Helicopter surveys require special navigation aids so that the area of interest is covered. Lines are pre-planned, and the navigation system then informs the pilot of the correct course to take.
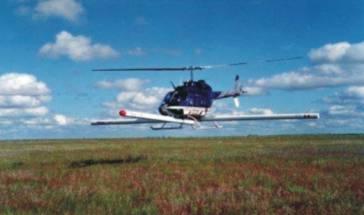
Figure 214. Helicopter-mounted magnetometer system. (Furgo Airborne Surveys)
Data Processing: Data processing involves assigning the correct spatial coordinates to each magnetic field reading and correcting the magnetic field data for diurnal variations.
Data Interpretation: Anomalies from magnetic field data consist of a magnetic high to the south of the magnetic source and a magnetic low to the north of the source. Neither the magnetic high nor the low are positioned over the top of the source, making determination of the spatial coordinates of the source difficult to locate accurately. Additional processing can be done to make the anomaly peak over the top of the source. This process is called calculation of the analytic signal and is routinely done for many magnetic surveys. The analytic signal and total magnetic field are shown in figure 215.
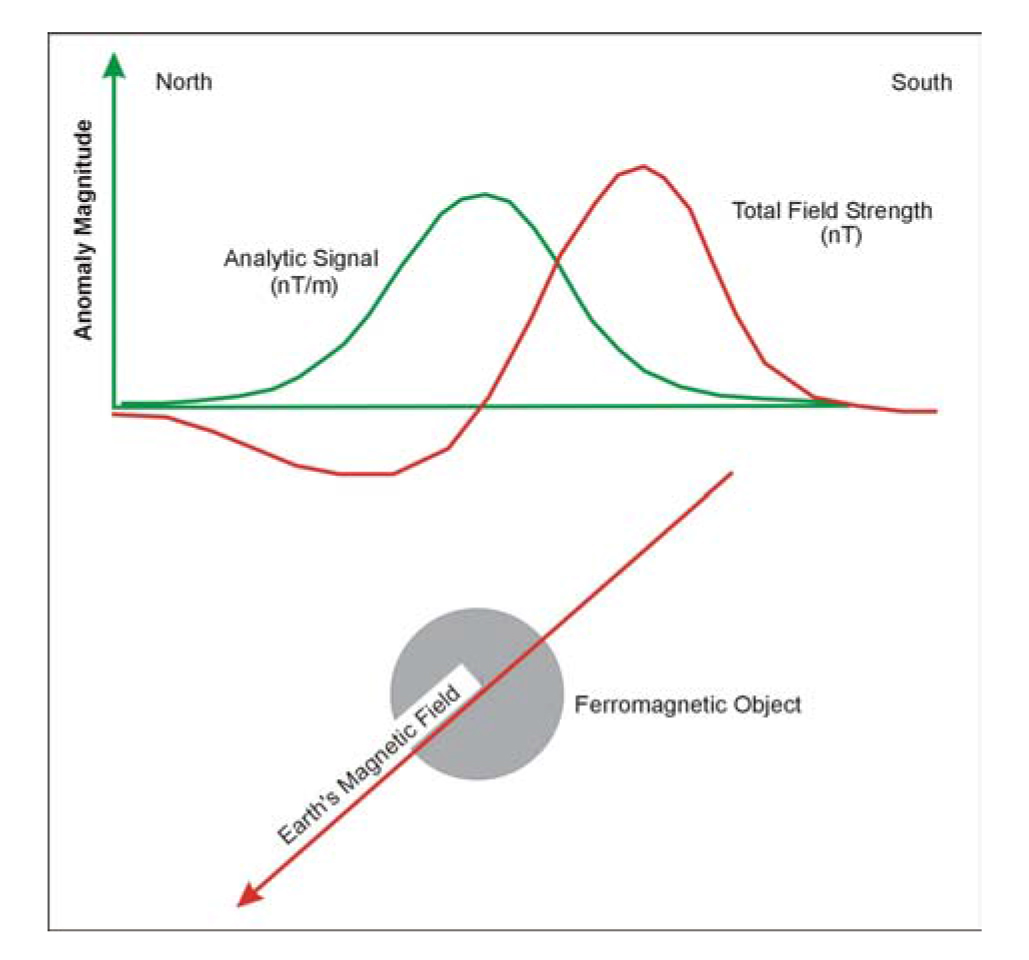
Figure 215. Analytic Signal
Figures 216 and 217 present the total magnetic field for an airborne helicopter magnetic survey (figure 9) and the analytic signal calculated using the same data. These data were acquired while flying at a height of a few meters above the vegetation, with some of the data being obtained at elevations of about 6 meters above the ground surface, over an area where earlier military activity had occurred.
Figure 216 shows the positive (red) and negative (blue) magnetic field values associated with each magnetic source. In figure 217 showing the Analytic Signal, only positive anomalies are seen. The peak of these anomalies is positioned over the source of the anomaly. Depths to the source of the magnetic anomalies can be determined from the analytic signal.
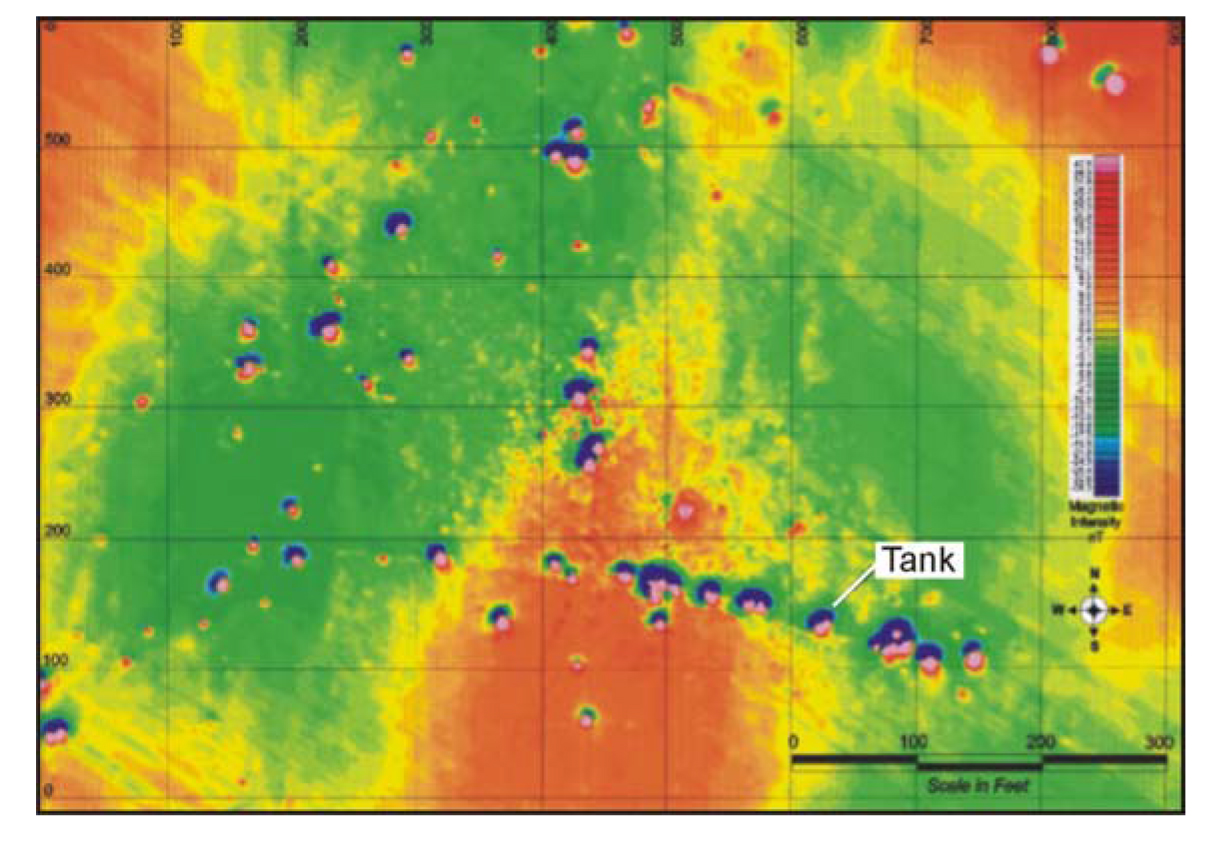
Figure 216. Total magnetic field data from a helicopter magnetic survey
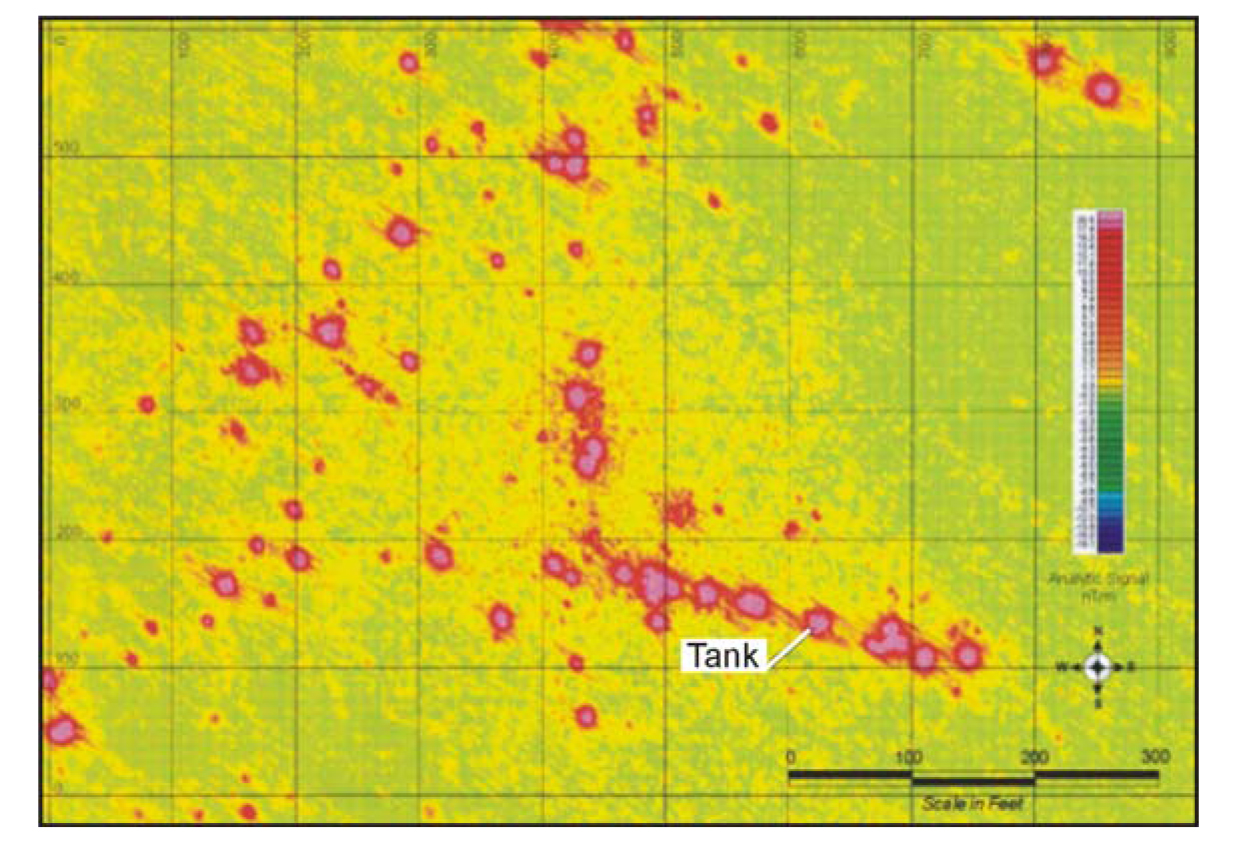
Figure 217. Analytic signal for data shown in figure 216.
Advantages: The magnetic method is fairly easy to use and provides anomalies from both near surface UXO and those buried at some depth, depending on their size.
Limitations: The magnetic method detects anomalies only from ferromagnetic sources. Objects made from stainless steel, copper, or aluminum will not provide a magnetic anomaly. If the diurnal variations in the Earth's magnetic field are high, it may be difficult to remove its influence completely from the data. Interpretation of the data for detailed analysis of the source of the anomalies is difficult. Thus, it is usually not possible to obtain any of the parameters (length, diameter) of the source of the anomaly.
Electromagnetic
Basic Concept: Electromagnetic methods use actively created electromagnetic fields to excite metal objects. These objects then radiate their own electromagnetic field that can be detected.
Two kinds of electromagnetic instruments are available. One operates in the frequency domain, and the other operates in the time domain. These instruments have a transmitter and receiver coil. The transmitter coil generates the electromagnetic field, and the receiver coil measures the resulting signal. Instruments that operate in the frequency domain transmit an electromagnetic field whose amplitude is sinusoidal at one or several frequencies from 30 Hz to over 20 kHz. Instruments that operate in the time domain generate electromagnetic pulses having a square wave shape for the signal. Electromagnetic systems can be used on the ground or they can be attached to aircraft and used for airborne surveys. Airborne EM systems have been used for mineral exploration and environmental surveys for many years. However, although one company (Fugro) advertises airborne EM systems for UXO, no data could be found regarding this system. Geonics Ltd. and the U.S. Army Corps of Engineers are designing another system.
There are several ground EM systems that are being used for UXO exploration. These include the EM61 (Geonics Ltd.) and GSM3 (Geophex, Inc.), all of which record data to memory. Systems that do not record data to memory include the Fisher and a metal detector manufactured by Minelab of South Australia and marketed by Geometrics under the name Metal Mapper.
The EM31 (figure 183) is primarily designed to measure the electrical conductivity of the ground. It does record an in-phase component reported to be appropriate for detecting metal, and tests have been conducted to find its usefulness for UXO exploration. As might be expected, the results were not encouraging since only large pieces of metal can be detected, and the instrument is rarely, if ever, used for UXO detection.
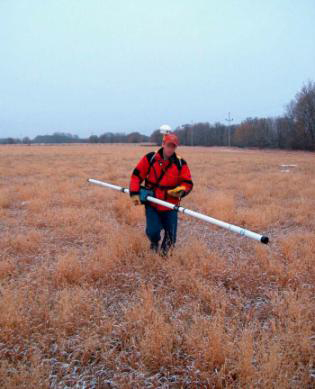
Figure 183. The EM31-MK2 instrument. (Geonics, Ltd.)
Probably the most commonly used instrument for UXO exploration is the EM61. This instrument is used as a single instrument, or it can be configured as a set of three, allowing greater ground coverage along each traverse.
Figure 184 shows a single EM61 being manually towed. The backpack contains controls and batteries. This system uses two coils, one placed vertically over the other with their planes parallel. The lower coil contains both a transmitter and a receiver coil and the upper coil is just a receiver coil. Data are recorded using both the lower and upper receiver coils. Since the lower coil is more influenced by surface metal than the upper coil, data from these two coils can be used to reduce the influence of surface metal on the data.
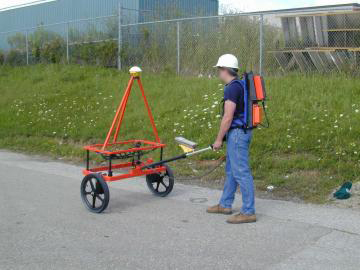
Figure 184. The EM61-Mk2 instrument. (Geonics, Ltd.)
Figure 218 shows a ganged system with an assembly of two EM61 instruments being towed by an All Terrain Vehicle. A GPS antenna is placed over the central EM61 to position the data.
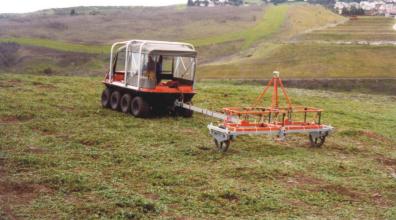
Figure 218. An array of two EM61 instruments. (Blackhawk GeoServices, Inc.)
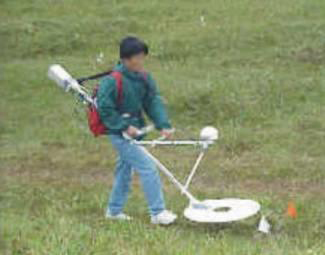
Figure 219. The GEM3. (Geophex Inc.)
Hand-held instruments include the Metal Mapper (Geometrics), the GEM3 (Geophex), the EM61 hand-held version, and the Fisher electromagnetic metal detector. Figure 219 shows the GEM3; Figure 185 shows the hand-held version of the EM61.
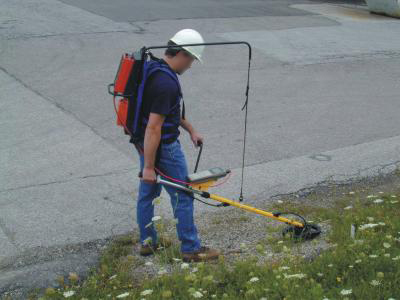
Figure 185. The EM61-HH2 hand held instruments (Geonics, Ltd.)
The GEM3 shown above has a GPS system attached allowing the position of the sensor coils to be determined at all times.
Data Acquisition: Surveys conducted with the towed systems are done along lines crossing the area of interest. Surveyor's spray paint may be used to show which lines have been recorded. At the start of each day, the equipment is tested over a known target to check that it is functioning properly. As with the magnetic surveys, latency tests with the GPS systems are required.
Hand-held instruments are usually used for "real time" surveys where the anomalies are located and marked at the same time.
Data Processing: Data from a towed array system, where a GPS positioning system is used, has to be processed and then applied to the electromagnetic data so as to provide the coordinates of the recorded data. The EM61 data can be processed using data from the two receiver coils. This allows a "differential" channel to be produced. This procedure involves amplifying the data from the upper coil so that anomalies from near-surface metal are seen as anomalies with similar amplitudes on both coils. The difference is then found between the data from the two coils, allowing the near-surface metal to be screened out of the data. During processing, the depth to the source of the anomaly is also calculated.
Data Interpretation: Electromagnetic data from UXO anomalies can theoretically be modeled to provide information regarding the shape of the source. Although this is not commonly done at the current time, it does have the potential to assist in preliminary discrimination since long objects, which might be more likely to be UXO than round objects, can be identified.
Advantages: The electromagnetic method reliably detects buried UXO and is not influenced by diurnal variations as is magnetic data.
Limitations: The resolution for the location of the source of any anomaly is diluted slightly by the area of the transmitter and receiver coils. This may be somewhat more significant with the EM61, which has coils with quite a large surface area, compared to the handheld EM61, which uses a much smaller coil. However, the size of the coil and the electrical current passing through it and used to produce the electromagnetic field are strongly related to the depth of investigation of the instrument. Exploration depths with the EM61 are limited to about 3 m.
Ground Penetrating Radar
Basic Concept: Ground Penetrating Radar (GPR) can be used to locate UXO. However, generally the method is slow and rather cumbersome compared to the magnetic and electromagnetic methods. It is primarily used for surveys covering small areas. The depth of investigation of GPR depends on the soil conditions. A saturated soil with significant clay will severely limit the penetration of the method. Ideal conditions are unsaturated, clay free soils. Depth of penetration also depends on the frequency of the signal. Different antennae provide different frequencies, which range from about 25 MHz to 2700 MHz. A low-frequency antenna (signal) will provide the best penetration depth. For UXO detection, a high-frequency antenna will be needed to locate small ordnance. A lower frequency antenna can be used for larger ordnance.
The GPR instrument consists of a recorder and a transmitting and receiving antenna. Figure 111 provides a drawing illustrating the GPR system.
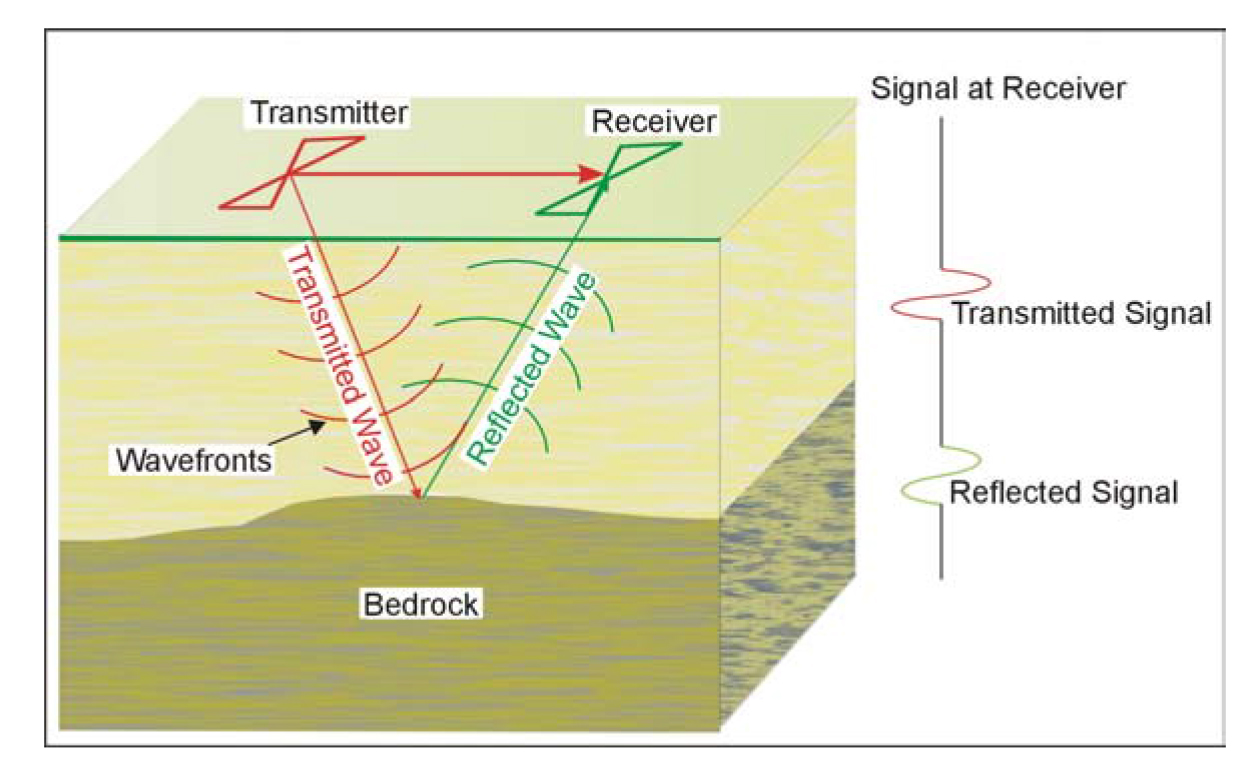
Figure 111. Ground Penetrating Radar system.
Figure 111 shows the GPR signal being transmitted into the ground. When it reaches an object, or interface with different dielectric properties, part of the wave is reflected back to the ground surface, where it is recorded by the receiving antenna.
Several companies manufacture GPR equipment. These include Geophysical Survey Systems, Inc (GSSI), GeoRadar, Inc, Mala GeoScience, and Sensors and Software Inc.
The 100 MHz antenna is suited for deeper applications to depths of about 20 m. This antenna can be used to locate larger ordnance at depth.
Data Acquisition: GPR surveys are conducted by pulling the antenna across the ground surface at a normal walking pace. The recorder stores the data as well as presenting a picture of the recorded data on a screen.
Data Processing: It is possible to process the data, much like the processing done on single channel reflection seismic data. Processing can include distance normalization, vertical and horizontal filtering, velocity corrections, and migration. However, depending on the data quality, this may not be done since the field records may be all that is needed to detect the ordnance.
Data Interpretation: If the depth to an anomaly is required, the speed of the GPR signal in the soil at the site has to be obtained. This can be estimated from ts showing speeds for typical soil types, or it can be obtained in the field by conducting a small traverse across a buried feature whose depth is known. Probably the most important feature of GPR is its ability to detect both metal and plastic UXO. Neither magnetic nor electromagnetic methods can detect plastic objects.
An example of GPR data from a site in Arizona is shown in figure 220, illustrating anomalies from both metal and plastic targets.
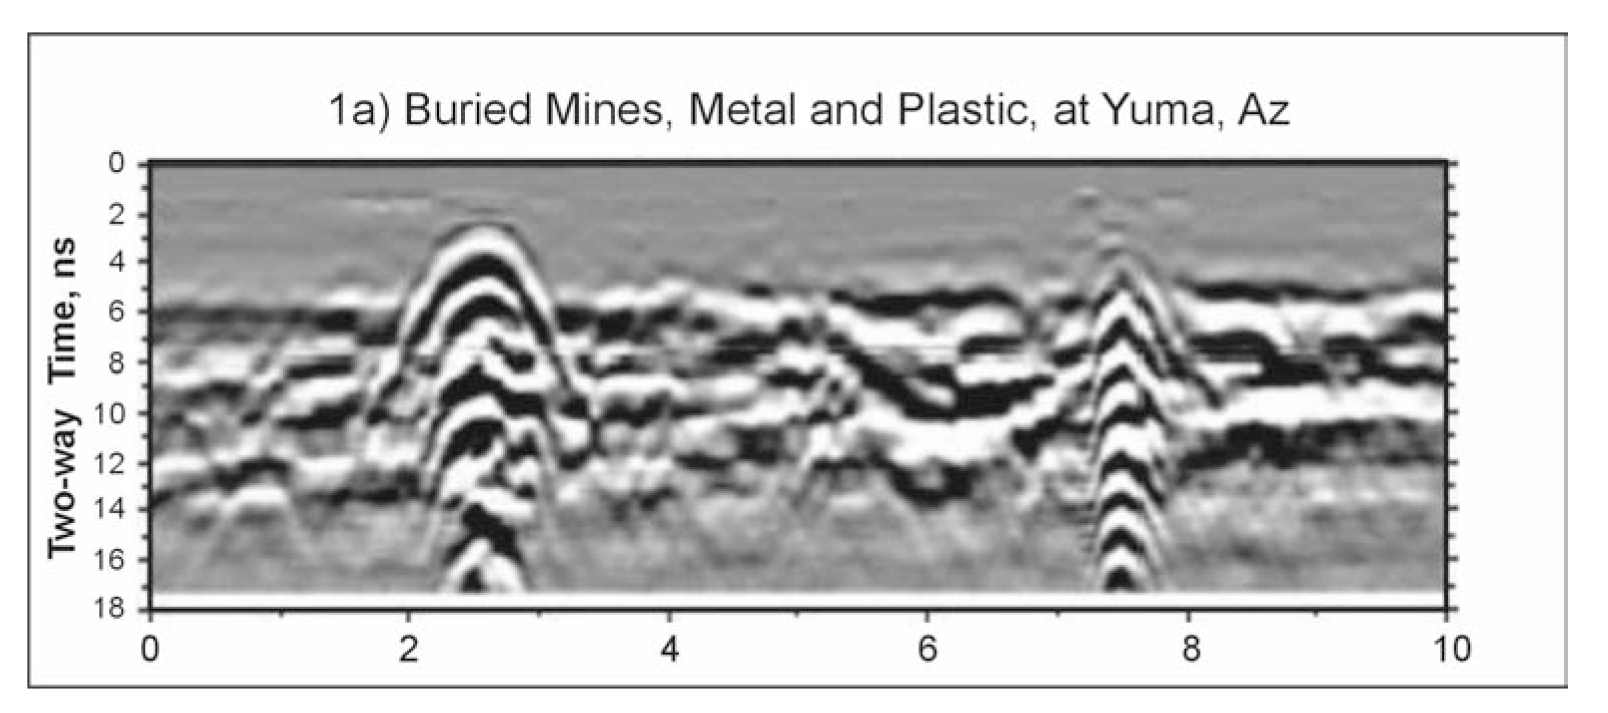
Figure 220. Ground Penetrating Radar data across buried metal and plastic mines. (Powers, et al. 1996)
Advantages: Probably the biggest advantage is that this method can detect both metal and plastic (nonmetal) buried UXO.
Limitations: Probably the most limiting factor for GPR surveys is that their success is very site specific and depends on having a contrast in the dielectric properties of the target compared to the host overburden, along with sufficient depth penetration to reach the target. However, it is likely that most ordnance will provide the desired dielectric contrast needed. Thus, depth of penetration and the resolution required are probably the most important factors. In soils containing many cobbles, reflections may be obtained from these cobbles making it difficult to distinguish cobbles from UXO. Another disadvantage of GPR systems is that the electromagnetic field transmitted could potentially detonate ordnance with electric fuses; therefore, its use is prohibited in areas where these fuses may exist.
Synthetic Aperture Radar
Two basic radar systems are used for various applications: real aperture radar and Synthetic Aperture Radar (SAR). The difference between these two systems is that SAR uses extensive processing to increase the effective size of the antenna. This results in higher resolution in the "along track" direction. SAR is predominantly used as an airborne system.
Other Methods
The following is a partial list of other methods used to locate UXO. These are either borderline geophysical methods or are physics-based rather than geophysics-based.
- Airborne GPR
- Infrared Radiometry
- Light Detect and Ranging (LIDAR)
- Acoustics. This technique is probably best suited to underwater detection.